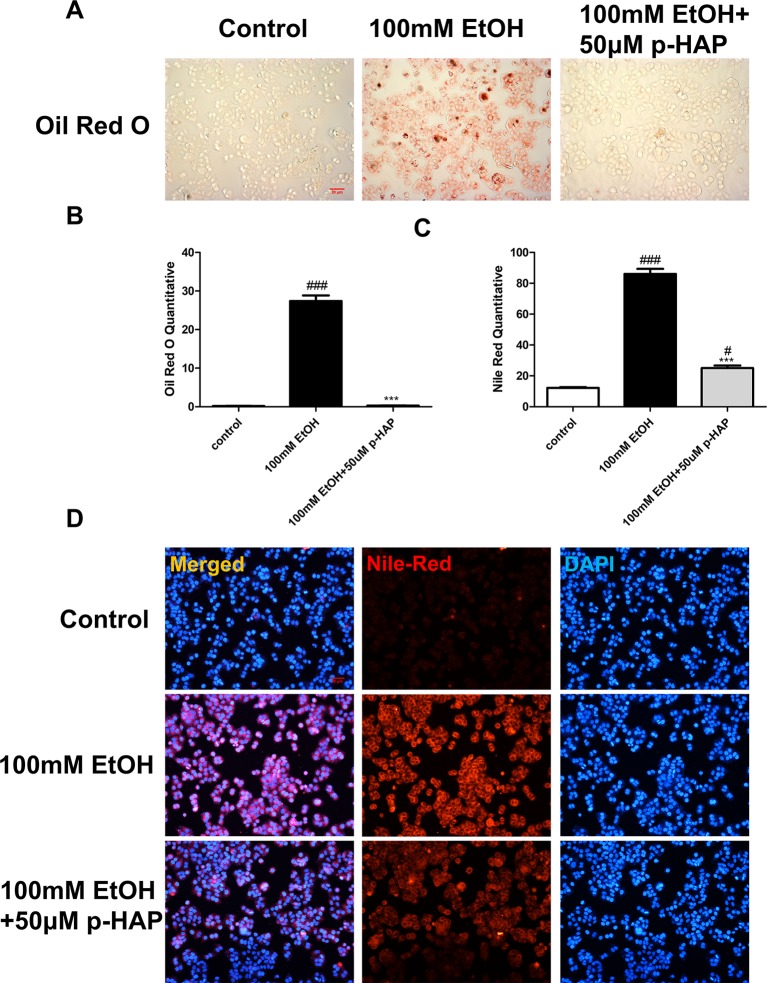
IMAGE

Figure 3

ID
ZDB-IMAGE-200214-3
Source
Figures for Huang et al., 2020
Image
Figure Caption

Figure 3

P-HAP reduced lipid accumulation inLO2 induced by alcohol. (A) Oil red O staining of LO2 slides. Figures are magnified as 100×. (B) Quantitative analysis of oil red O staining in LO2 treated with 100 mM ethanol, 50 μM p-HAP and the control. (C) Quantitative analysis of Nile red staining in LO2. The data are displayed as the means ± SDs (#P <0.05 vs the control group; *P <0.05 vs the 100 mM EtOH group). (D) Nile red staining of LO2. Figures are magnified as 100×. ###P < 0.001 vs the control group, ***P < 0.001 vs the 350 mM ethanol group.

Acknowledgments
This image is the copyrighted work of the attributed author or publisher, and ZFIN has permission only to display this image to its users. Additional permissions should be obtained from the applicable author or publisher of the image. Full text @ Front Pharmacol