
- Title
-
Stepwise polarisation of developing bilayered epidermis is mediated by aPKC and E-cadherin in zebrafish
- Authors
- Arora, P., Dongre, S., Raman, R., Sonawane, M.
- Source
- Full text @ Elife
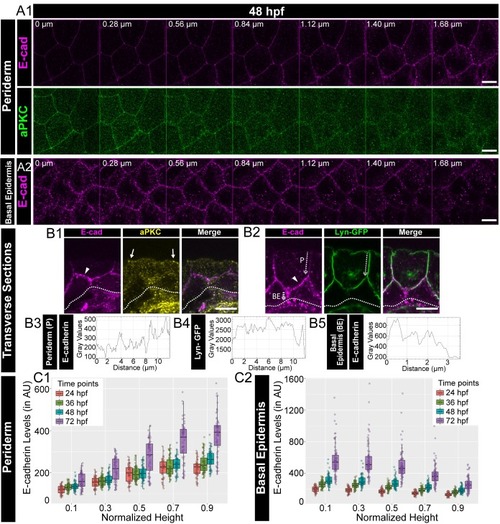
Confocal images of the periderm (A1) and basal epidermis (A2) showing localisation of E-cadherin (magenta) and aPKC (green) along various cell-heights at 48hpf in wild type embryos. Note 0 µm is the apical most section in both periderm as well as in the basal epidermis. Transverse sections of the epidermis covering the eye showing localisation of (B1) E-cadherin (magenta) and aPKC (yellow) and (B2) E-cadherin (magenta) and Lyn-GFP (green). Dotted arrows mark the cell boundary (B2) used for line intensity profiles for E-cadherin (B3) and Lyn-GFP (B4) in the Periderm (P) and for E-cadherin (B5) in Basal epidermis (BE). Quantification of E-cadherin levels along apicobasal axis at the normalised cell heights in the periderm (C1) and the basal epidermis (C2) at different developmental time points. Arrowheads in B1 and B2 point to maximum levels of E-cadherin at the interface of the two layers. Solid arrows in B1 point to aPKC localisation. Dotted lines mark the base of the epidermis. Scale bar is equivalent to 10 µm (A1, A2, B1, B2). AU = Arbitrary Units. Source file with fluorescence intensities for periderm and basal epidermis is available as Figure 1—source data 1 and 2 respectively. |
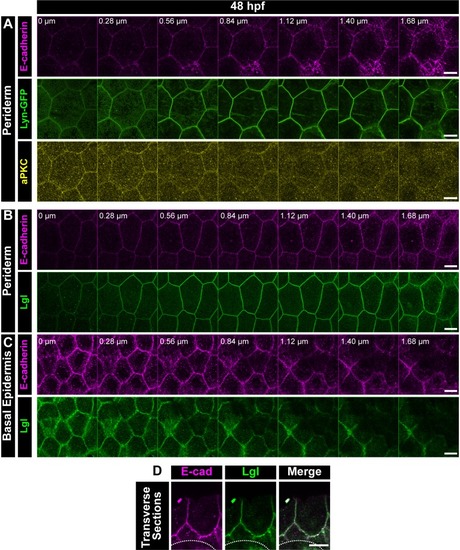
Confocal Z-stack showing localisation of E-cadherin (magenta), Lyn-GFP (green) and aPKC (yellow) in the periderm ( |

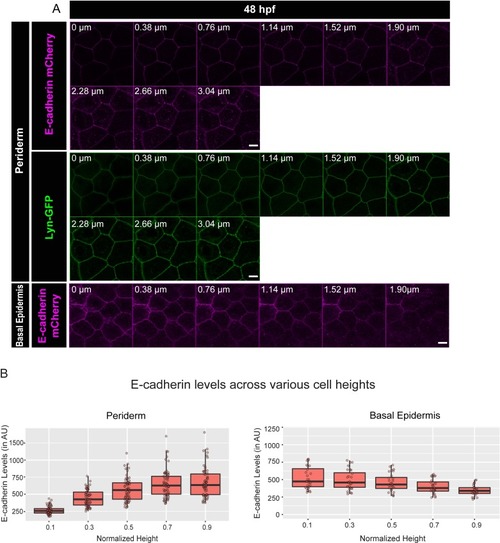
Confocal analysis of E-cadherin (magenta) immunolocalisation along the apicobasal axis (0 µm is apical) in the periderm ( |
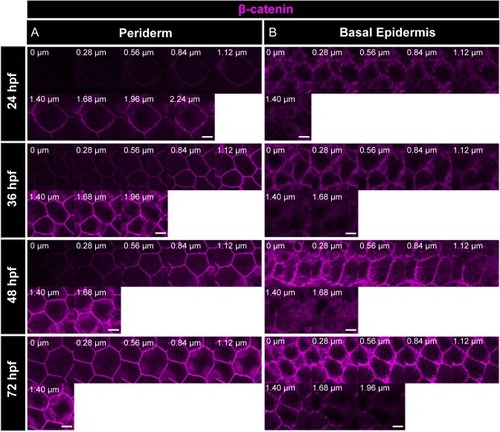
Immunostaining of β-catenin reveals that the adherens junctions are present along the apicobasal axis in periderm ( |
|
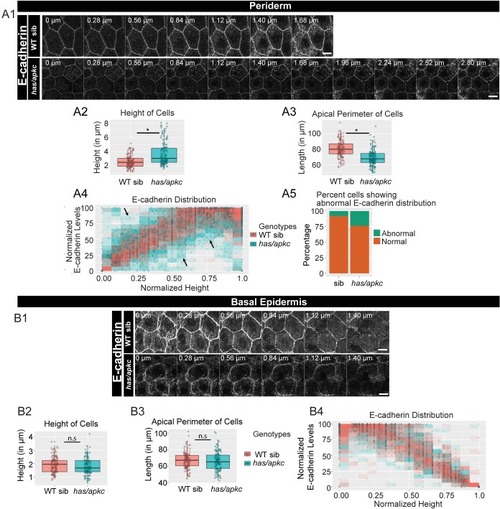
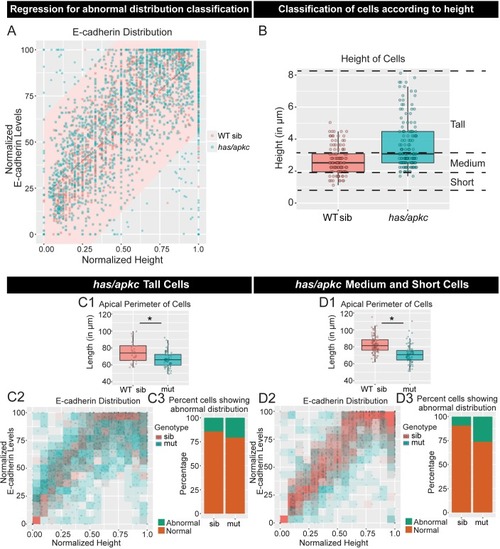
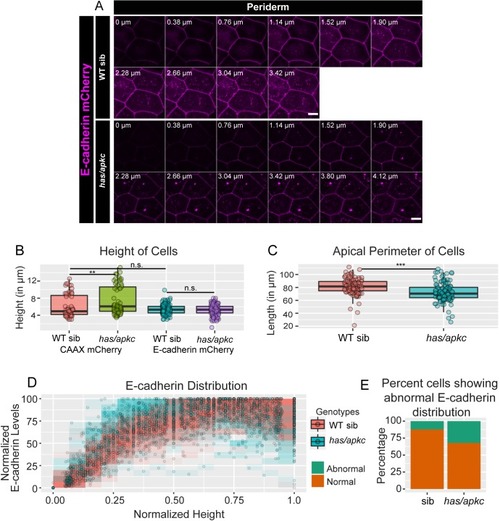
Immunolocalisation of E-cadherin along the apicobasal axis (0 µm is apical) in wild-type (WT) sibling and has/apkc mutant in the periderm (A1) and basal epidermis (B1) at 48hpf. Comparison of height of cells (A2, B2) and apical perimeter (A3, B3) in the periderm (A2, A3) and basal epidermis (B2, B3) of the two genetic conditions. Graphs showing polarised localisation of E-cadherin across normalised cell height in the periderm (A4) and basal epidermis (B4). A graph showing noise index in E-cadherin localisation in WT siblings versus has/apkc mutants (A5). Arrows in A4 pointing to the abnormal localisation of E-cadherin. Scale bars in A1, B1 are equivalent to 10 µm. AU = Arbitrary Units; WT = wild type, sib = sibling/s and has/apkc = has/apkc mutants. Asterisk indicates significant difference at p<0.05 and n.s. means non-significant difference observed by Mann Whitney U test. Source file with fluorescence intensities for periderm and basal epidermis is available as Figure 2—source data 1 and 2, respectively. Statistical analysis with p values for all the graphs of periderm and basal epidermis is available as Figure 2—source data 3 and 4, respectively. |
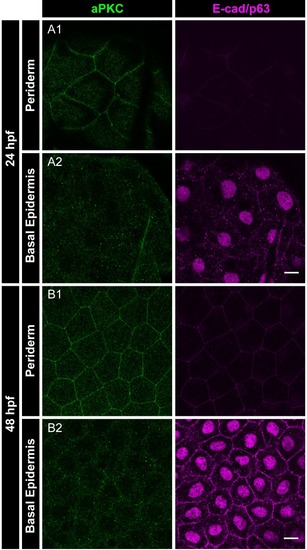
Immunolocalisation of aPKC (green) and E-cadherin as well as p63 (basal epidermis marker; both magenta) in the periderm and basal epidermis at 24hpf ( |
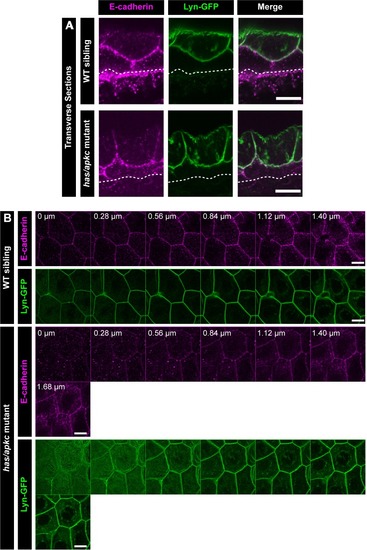
Transverse section through the dorsal head epidermis at 48hpf showing localisation of E-cadherin (magenta) and Lyn-GFP (green) along the apicobasal axis in WT siblings and |
|
|
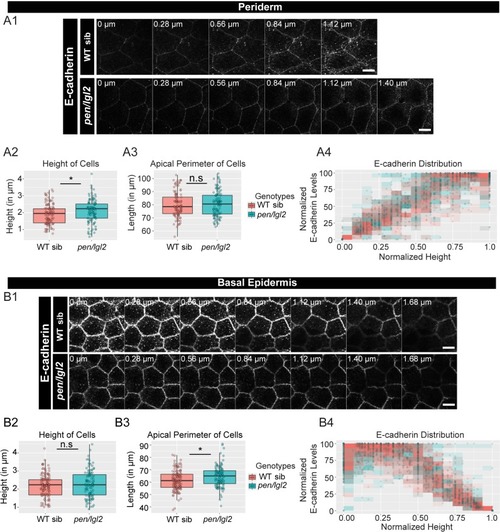
The loss of pen/lgl2 function has no effect on E-cadherin polarity. Immunolocalisation of E-cadherin at various cell heights (0 µm is apical) along the apicobasal axis in wild-type sibling (WT sib) and pen/lgl2 mutant in the periderm (A1) and basal epidermis (B1) at 72hpf. Comparison between WT siblings and pen/lgl2 mutants in the periderm (A2–A4) and the basal epidermis (B2–B4) for height of cells (A2, B2) and apical perimeter (A3, B3). Graphs showing polarised distribution of E-cadherin across normalised cell height in the periderm (A4) and basal epidermis (B4) in WT siblings and pen/lgl2 mutants. Scale bar corresponds to 10 µm in A1 and B1. AU = Arbitrary Units; WT = wild type and sib = sibling/s. Asterisk indicates significant difference (p<0.05) and n.s. means non-significant difference by Mann Whitney U statistical test. Source file with fluorescence intensities for periderm and basal epidermis is available as Figure 3—source data 1 and 2, respectively. Statistical analysis with p values for all the graphs of periderm and basal epidermis is available as Figure 3—source data 3 and 4, respectively. |
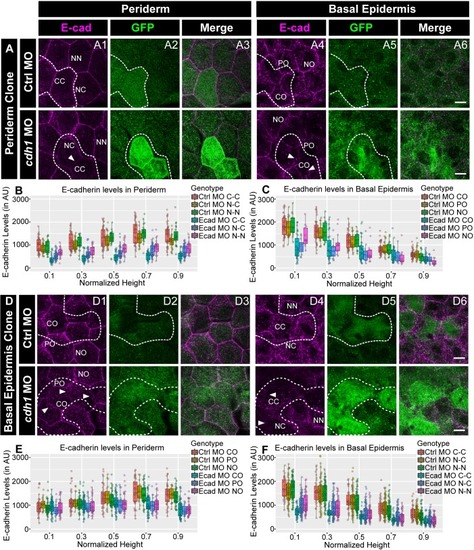
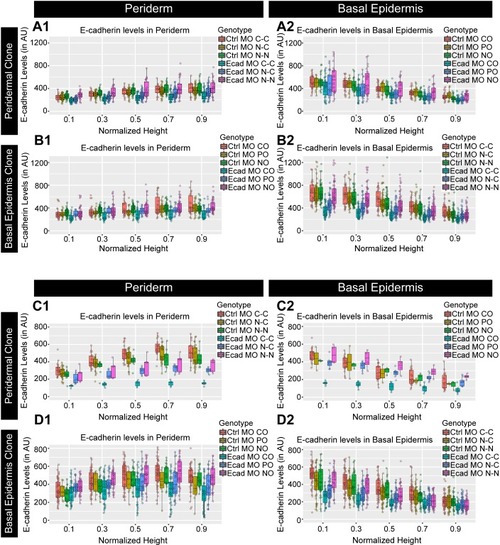
Confocal images of E-cadherin (magenta) localisation in GFP clones (green) carrying cadherin-1 morpholino (cdh-1 MO) and control morpholino (Ctrl MO) in the periderm (A) and basal epidermis (D). (A1–A3) shows peridermal clone and its effect on E-cadherin localisation in the basal epidermal cells (A4–A6). (D4–D6) show a basal epidermis clone and its effect on E-cadherin localisation in the periderm (D1–D3). Graphs showing effect on E-cadherin levels across normalised cell height in the periderm (B, E) and basal epidermis (C, F) across different boundaries upon knockdown of e-cadherin in a clonal manner. The boundaries Clone-Clone (C–C), Clone-Non-clone (N–C), and Non clone-Non clone (N–N) are within the same layer with respect to the clones whereas boundaries showing Complete Overlap (CO), Partial Overlap (PO), and No Overlap (NO) are in the cells of the juxtaposed layer. Dotted line in (A1, A2) represents the position of the peridermal clone and the basal epidermal region below the clone (A4, A5). Similarly, dotted lines in (D4, D5) mark the clones in the basal epidermis and the peridermal region above the clone (D1, D2). Arrowheads point to the loss/reduction in E-cadherin staining at the cell membranes. Scale bar represents 10 µm in (A6, D6). AU = Arbitrary Units. Source file with fluorescence intensities for peridermal clone and E-cadherin analysis at the boundaries in the periderm (B) and basal epidermis (C) is available as Figure 4—source data 1 and 2, respectively. Fluorescence intensities for basal epidermal clones and analysis at the boundaries in periderm (E) and basal epidermis (F) is available as Figure 4—source data 3 and 4, respectively. Statistical analysis consisting of intensity comparisons is available as Figure 4—source data 5. |
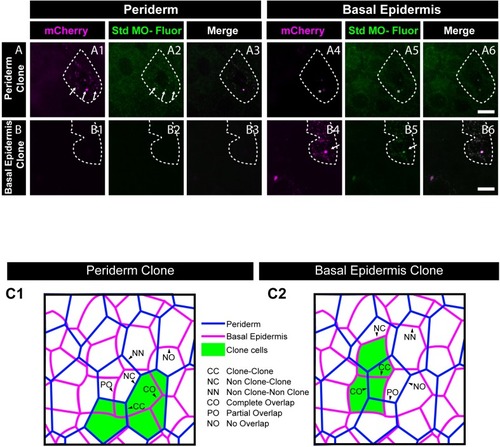
Morpholino tagged with Carboxyfluorescein ( |
|
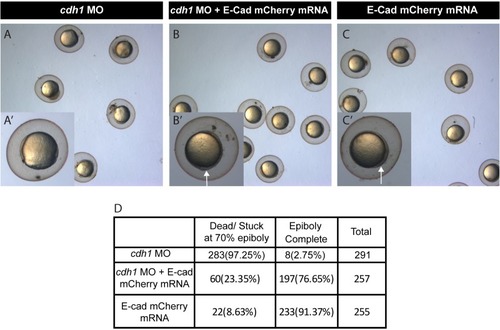
Brightfield image of zebrafish embryos injected with Cdh-1 MO ( |
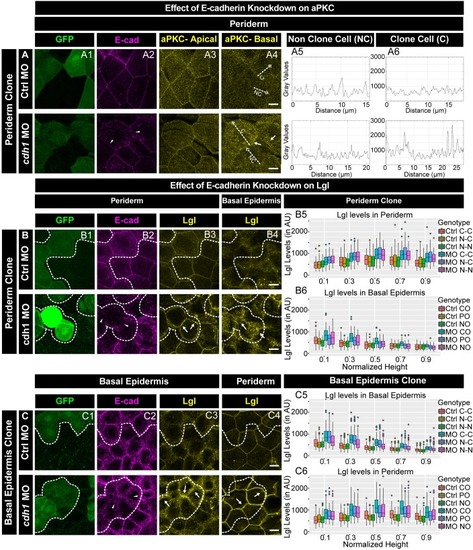
E-cadherin regulates localisation of aPKC and Lgl2 in the epidermis. Confocal images showing GFP marked clones (A1, B1, C1) marking cadherin-1 morpholino (cdh-1 MO) or control MO (Ctrl MO) and immunolocalisation of E-cadherin (A2, B2, C2), aPKC (A3, A4) and Lgl2 (B3, B4, C3, C4). Arrowhead marks the loss of E-cadherin in morphant cells (A2, B2, C2). Different z-stacks depicting apical (A3) or basal domains (A4) of peridermal cells showing aPKC immunostaining. Arrow shows enrichment of aPKC in the basal domain of the cdh-1 morphant cells (A4). Intensity profiles for aPKC in the basal domain in non-clone (NC) cells (A5) and clone (C) cells (A6) were measured along the dotted arrows (in A4). Lgl staining in the periderm (B3, C4) or basal epidermis (B4, C3). Arrows show the high levels of Lgl in the morphant or juxtaposed cells (B3, B4, C3, and C4) upon e-cadherin knockdown. Graphs showing levels of Lgl across normalised cell height in the periderm (B5, C6) and basal epidermis (B6, C5) across different boundaries mentioned. Dotted line indicates the position of the clone in the periderm (B1–B3) or basal epidermis (C1–C3) and corresponding region in basal epidermis (B4) or periderm (C4), respectively. Scale bar represents 10 µm in (A4, B4, C4). AU = Arbitrary Units. Source file with fluorescence intensities for peridermal clone and boundary analysis in periderm (B5) and basal epidermis (B6) is available as Figure 5—source data 1 and 2, respectively. Fluorescence intensities for basal epidermis clone and analysis of boundaries in basal epidermis (C5) and periderm (C6) is available as Figure 5—source data 3 and 4, respectively. Statistical analysis of intensity comparisons along with p values is available as Figure 5—source data 5. |
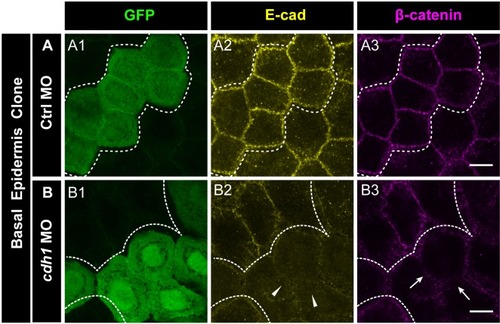
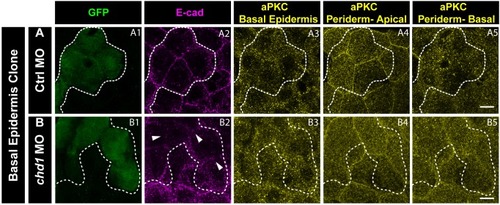
Immunostainings of embryos harbouring Ctrl MO ( |
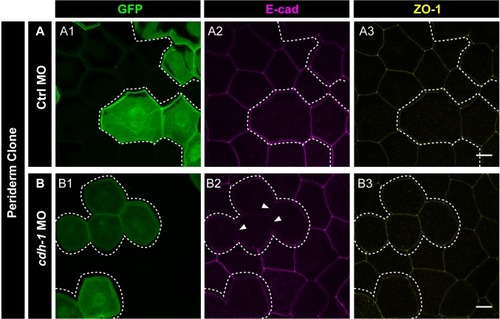
Immunostaining of embryos having Ctrl MO ( |
Confocal micrographs of embryos with Ctrl MO ( |
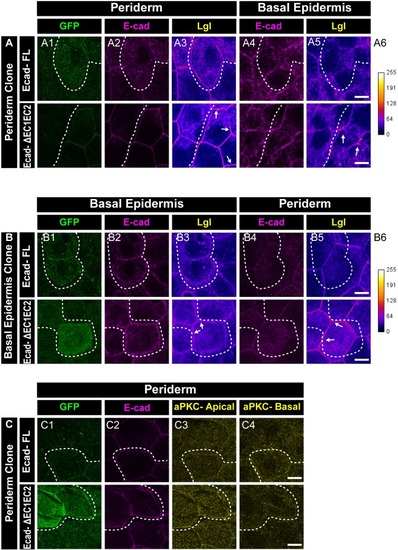
Confocal images showing expression and localisation of GFP tagged E-cadherin-FL and ΔEC1-EC2-Ecad (green) ( |