FIGURE SUMMARY
Title

Zebrafish C-reactive protein isoforms inhibit SVCV replication by blocking autophagy through interactions with cell membrane cholesterol

Authors
Bello-Perez, M., Pereiro, P., Coll, J., Novoa, B., Perez, L., Falco, A.
Source
Full text @ Sci. Rep.

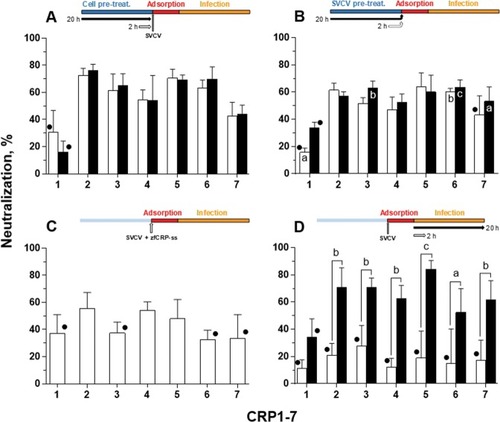
Effect of CRP treatment on SVCV replication in EPC cells. The neutralization activity of CRP1-7 was analysed by adding each CRP at different points of SVCV replication by incubating the CRP with (A) EPC cells before virus adsorption, (B) SVCV before and during virus adsorption, (C) both EPC cells and SVCV only during virus adsorption and (D) infected EPC cells (i.e., after adsorption). The duration of incubations was either 2 h (white bars) or 20 h (black bars). Descriptions of the experimental timeline charts are included as insets at the top of each corresponding graph. SVCV infection was determined by the focus forming assay. The data are expressed as percentages of neutralization. Graphs represent the mean and s.d. of three independent experiments, each performed in triplicate. • Indicates no significant differences between the treatment and the control (GFP treatment). The significant differences determined as P < 0.05, P < 0.01 and P < 0.001 were indicated as a, b or c, respectively. Inside-bar symbols from graph (B) indicate significant differences in comparison to corresponding CRP treatments in (C). Statistically significant differences between different times within the same CRP treatment are shown with symbols over the keys connecting both groups. Data were analysed by using two-way ANOVA with Sidak’s multiple comparisons test.

Interaction of CRP1-7 on SVCV replication in EPC cells. (A) SVCV binding levels to EPC cell surfaces in the presence of CRP1-7. EPC cell-bound SVCV particles in the presence of CRP were quantified by the number of SVCV n gene copies determined by RT-qPCR, and the data are expressed, relative to the number of ef1a transcripts, as fold changes. (B) CRP1-7 inhibition of the fusogenic activity of SVCV G protein on the surface of SVCV-infected EPC cells. The levels of G protein-mediated syncytia of 5 or more cells in SVCV-infected EPC cell monolayers were determined by triggering cell fusion at pH 6 in the presence of CRP and are expressed as percentage of the counted syncytia. (C) The time course of SVCV replication in vitro at early stages post adsorption. EPC cell monolayers were incubated for 2 h with the CRP-mix before viral adsorption, and the SVCV replication was estimated by measuring the expression of SVCV n and g gene transcripts by RT-qPCR and is expressed as fold changes. (D) Modulation of the IFN system by CRP1-7. The transcript levels of the IFN-response reporter mx gene were quantified by RT-qPCR in EPC cells 20 h after treatment with CRP for 2 h and were normalized to the corresponding ef1a levels. The data are expressed as fold changes. (E) Presence of antiviral factors in supernatants from CRP1-7-treated EPC cell monolayers. SVCV neutralization was induced by supernatants collected from EPC cells previously treated for 2 h with CRP1-7 and was determined by the focus forming assay. The results are expressed relative to GFP treatments. All experiments were performed 3 times each in triplicate, except for (C,D), which were performed twice each in quadruplicate. The data are presented as the mean and s.d. The significantly different levels between them are indicated with symbols as in Fig. 1. Data were analysed by using one-way ANOVA (A,B,D,E) and two-way ANOVA (C) with Sidak’s multiple comparisons test.

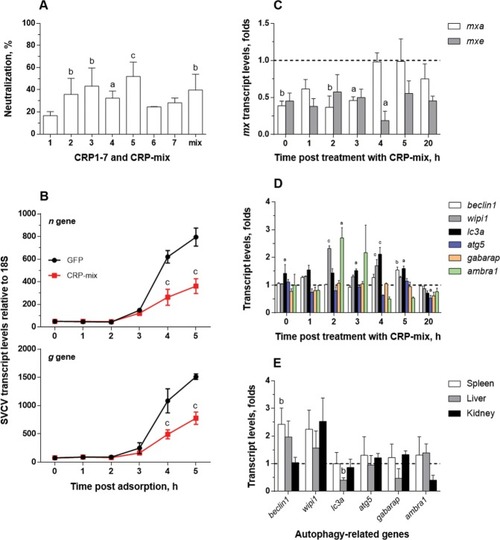
Interaction of CRP1-7 on SVCV replication in ZF4 zebrafish cells. (A) SVCV neutralization of CRP1-7 and CRP-mix when incubated with ZF4 cells for 2 h before virus adsorption. SVCV infection was determined by the focus forming assay. The results are represented as percentages of neutralization. These experiments were performed 3 times each in triplicate. (B) Time course of SVCV replication at early stages post adsorption. SVCV replication levels in ZF4 cells, incubated for 2 h with CRP-mix before viral adsorption, were determined at 0–5 h by measuring the expression of SVCV n and g gene transcripts by RT-qPCR. They are expressed as fold changes. (C) Induction of the IFN system by the CRP-mix. The transcript levels of the two IFN-response reporter gene isoforms of Mx (mxa and mxe) were quantified by RT-qPCR in ZF4 cells treated with the CRP-mix for 2 h before viral infection at different times post adsorption (0–5 and 20 h). The data were normalized to the corresponding 18S ribosomal levels and expressed as in Fig. 2D. (D) Capacity of the CRP-mix to modulate autophagy-related transcripts in vitro. The transcript levels of the relevant autophagy genes (beclin1, wipi1, lc3a, atg5, gabarap and ambra1) were quantified as described in in non-infected ZF4 cells (C). All gene expression studies were performed twice in quadruplicate in vitro. (E) Capacity of the CRP-mix to modulate autophagy-related gene transcripts in vivo. Four (non-infected) adult zebrafish were i.p. injected with the CRP-mix. Two days post injection, the transcript levels of the autophagy-related genes previously analysed in vitro were quantified by RT-qPCR in spleen, liver and kidney tissues. The data were normalized to the corresponding 18S ribosomal levels and expressed as fold changes. All data are presented as the mean and s.d. The statistically significant differences between them are indicated with symbols as indicated in Fig. 1. Data were analysed by using one-way ANOVA (A) and two-way ANOVA (BD) with Sidak’s multiple comparisons test and multiple Student’s t-tests by the Holm-Sidak method (E).

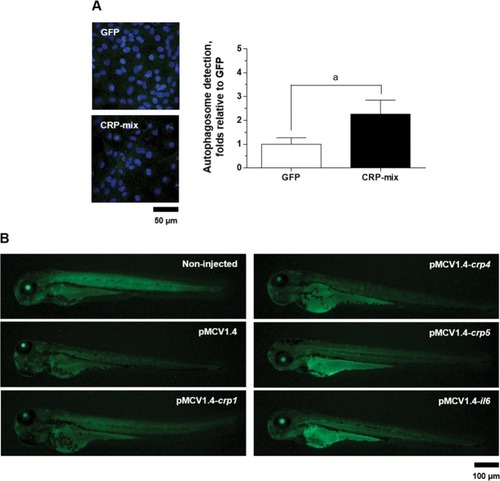
LC3 recruitment by selected CRPs in ZF4 cells and in zebrafish larvae. (A) Representative confocal images of the FITC immune-labelled LC3B in ZF4 cells treated with either GFP or the CRP-mix for 4 h. Nuclei were stained with DAPI. Autophagosome levels were quantified as the area (per cell) of over-threshold green fluorescence corresponding to the intracellular puncta and represented as fold changes in comparison to the GFP treatment as determined by the following formula: over-threshold fluorescence per cell in CRP-mix-treated monolayers/over-threshold fluorescence per cell in GFP-treated monolayers. This experiment was performed 3 times, each in triplicate. Symbol’a’ indicates statistically significant differences between CRP-mix and GFP treatments at the P < 0.05 level. Data were analysed by using two-tailed unpaired Student’s t-test. (B) Representative images of GFP-LC3 transgenic zebrafish larvae at 3 days post injection with 150 pg of pMCV1.4 or pMCV1.4-crp1/crp4/crp5/il6 plasmid constructs. Corresponding scale bars equal 50 and 100 µm.

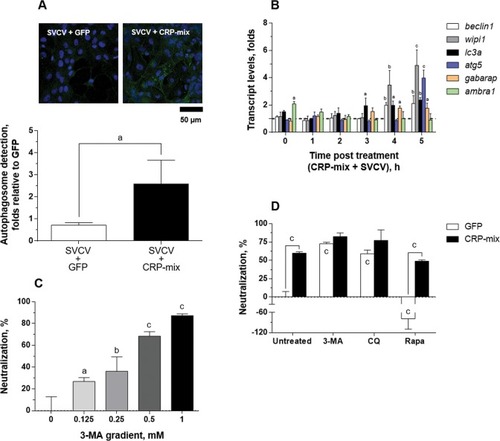
Autophagy induced by CRP-mix on SVCV replication in the ZF4 cells. (A) Representative confocal images of the FITC immune-labelled LC3B in the ZF4 cells treated with either GFP or CRP-mix together with SVCV for 4 h. Nuclei were stained with DAPI. Autophagosome levels were quantified as described in Fig. 4 and in the methods. The scale bar is equal to 50 µm. (B) Ability of the CRP-mix to modulate autophagy-related gene transcription in vitro during SVCV infection. The transcript levels of the genes of relevant autophagy elements (beclin1, wipi1, lc3a, atg5, gabarap and ambra1) were quantified by RT-qPCR in ZF4 cells treated with CRP-mix for 2 h before to viral inoculation (MOI of 1) at different times post adsorption (0–5 and 20 h). This experiment was performed twice in quadruplicate. The data are expressed as indicated in Fig. 3. (C) Effect of the autophagy blocker 3-MA on SVCV replication is shown. The SVCV neutralization activity of a gradient of 3-MA (0–1 mM) when incubated with EPC cells for 20 h prior to virus adsorption was assessed. SVCV infection was determined by the focus forming assay. The results are represented as the percentages of neutralization relative to the untreated group. (D) Effects of the CRP-mix on the SVCV neutralizing activity of autophagy modulators in vitro. SVCV infectivity was assessed on EPC cells treated with 3-MA (1 mM, 20 h), CQ (25 μM, 30 min) and rapamycin (Rapa, 25 μM, 4 h) and then incubated for 2 h with the CRP-mix before infection. SVCV infection was determined by the focus forming assay, and the data are presented as in (C) and relative to the GFP-treated group. Statistically significant differences in comparison to corresponding untreated groups and GFP are shown inside and on top of the bars, respectively. Neutralization experiments were performed 3 times each in triplicate. The statistically significant level differences are indicated with symbols as indicated in Fig. 1. Data were analysed by using one-way ANOVA (C) and two-way ANOVA (B,D) with Sidak’s multiple comparisons test and two-tailed unpaired Student’s t-test (A).

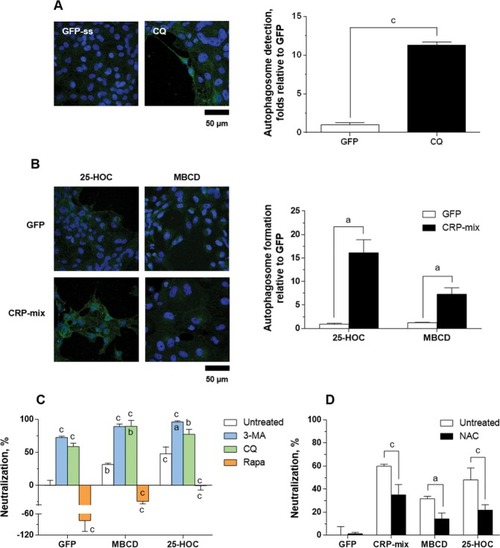
Autophagy and ROS generation during SVCV neutralizing activity induced by 25-HOC and MBCD together with the CRP-mix. Representative confocal images of the FITC immune-labelled LC3B in the ZF4 cells treated with (A) either GFP or CQ (25 µM) and (B) 10 μg/mL of 25-HOC or 4 mM MBCD alone or in combination with CRP-mix for 4 h. Nuclei were stained with DAPI. Autophagosome levels were quantified as described in Fig. 4 and in the methods. The scale bar is equal to 50 µm. (C) Effect of 25-HOC and MBCD on the SVCV neutralizing activity of autophagy modulators in vitro. SVCV infectivity was assessed for EPC cells treated with 3-MA (1 mM, 20 h), CQ (25 μM, 30 min) and rapamycin (Rapa, 25 μM, 4 h) and then incubated for 2 h with 10 μg/mL of 25-HOC or 1 mM MBCD before infection. SVCV infection was determined by the focus forming assay. Statistically significant differences in comparison to the corresponding GFP and untreated groups are shown inside and on top of the bars, respectively. (D) Effect of NAC on the SVCV neutralizing activity of the CRP-mix, 25-HOC and MBCD in vitro. SVCV infectivity was assessed for EPC cells treated with NAC (1 mM, 20 h) and then incubated for 2 h with either GFP, CRP-mix, 10 μg/mL of 25-HOC or 1 mM MBCD before infection. SVCV infection was determined by the focus forming assay. The results from the neutralization assays are represented as in Fig. 5. These experiments were performed 3 times in triplicate. All statistically significant level differences between treatment and corresponding control groups are indicated with symbols as in Fig. 1. Data were analysed by using two-tailed unpaired Student’s t-test (A,B) and two-way ANOVA with Sidak’s multiple comparisons test (C,D).

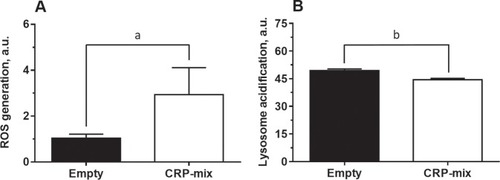
ROS generation and alkalization of intracellular pH induced by CRPs. (A) Effect of CRPs to generate oxidative stress in vitro. ROS formation was quantified in ZF4 cells transfected with pMCV1.4-crp1-7 for 48 h and incubated for 30 min with the stress indicator CM-H2DCFDA. ROS generation was determined measuring fluorescence intensity (n = 4). (B) Ability of the CRP-mix to modulate the pH of lysosomes. Changes in the lysosomal pH were determined in ZF4 cells co-transfected with each crp-encoding plasmid for 48 h and stained with LysoTracker Green DND-26 for 30 min. The quantification of the green fluorescence was carried out by flow-cytometry (n = 6). Results are shown in arbitrary units (a.u.). All statistically significant level differences between treatment and corresponding control groups are indicated with symbols as in Fig. 1. Data were analysed by using two-tailed unpaired Student’s t-test.

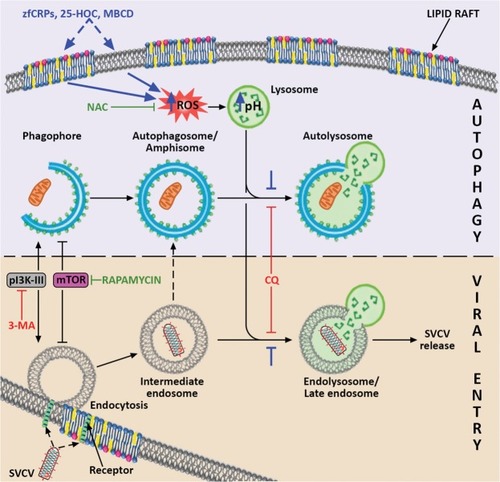
Proposed model for the mechanism by which CRPs, 25-HOC and MBCD interact with autophagy and SVCV entry. It is suggested that these three compounds (their proposed effects are indicated in blue) produce an imbalance in the membrane cholesterol of the lipid rafts, which induces the increase of intracellular ROS. In turn, ROS stimulate the increase in lysosomal pH, which reduces both the fusion of lysosomes and intermediate endosomes (indicated with blue stoppers), and consequently the formation of late endosomes/endolysosomes. Because of their low pH, SVCV requires the formation of endolysosomes to trigger the fusion conformation of the SVCV G protein for viral entry, and a blockade of endolysosomes thus impairs SVCV release into the host’s cytosol. The scheme shows that SVCV endocytic and autophagy pathways share common elements that enable the action of particular autophagy modulators on both of them. The convergence of pathways that may result in the formation of amphisome, as described for other viruses, is also indicated. The positive regulators of both routes are drawn in green, and the negative regulators are presented in red. Artwork drawn and provided by Mr. Diego Sanz.

Acknowledgments
This image is the copyrighted work of the attributed author or publisher, and ZFIN has permission only to display this image to its users. Additional permissions should be obtained from the applicable author or publisher of the image. Full text @ Sci. Rep.