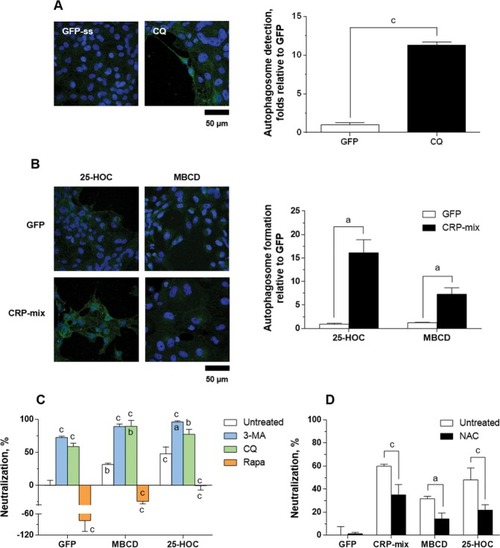
Autophagy and ROS generation during SVCV neutralizing activity induced by 25-HOC and MBCD together with the CRP-mix. Representative confocal images of the FITC immune-labelled LC3B in the ZF4 cells treated with (A) either GFP or CQ (25 µM) and (B) 10 μg/mL of 25-HOC or 4 mM MBCD alone or in combination with CRP-mix for 4 h. Nuclei were stained with DAPI. Autophagosome levels were quantified as described in Fig. 4 and in the methods. The scale bar is equal to 50 µm. (C) Effect of 25-HOC and MBCD on the SVCV neutralizing activity of autophagy modulators in vitro. SVCV infectivity was assessed for EPC cells treated with 3-MA (1 mM, 20 h), CQ (25 μM, 30 min) and rapamycin (Rapa, 25 μM, 4 h) and then incubated for 2 h with 10 μg/mL of 25-HOC or 1 mM MBCD before infection. SVCV infection was determined by the focus forming assay. Statistically significant differences in comparison to the corresponding GFP and untreated groups are shown inside and on top of the bars, respectively. (D) Effect of NAC on the SVCV neutralizing activity of the CRP-mix, 25-HOC and MBCD in vitro. SVCV infectivity was assessed for EPC cells treated with NAC (1 mM, 20 h) and then incubated for 2 h with either GFP, CRP-mix, 10 μg/mL of 25-HOC or 1 mM MBCD before infection. SVCV infection was determined by the focus forming assay. The results from the neutralization assays are represented as in Fig. 5. These experiments were performed 3 times in triplicate. All statistically significant level differences between treatment and corresponding control groups are indicated with symbols as in Fig. 1. Data were analysed by using two-tailed unpaired Student’s t-test (A,B) and two-way ANOVA with Sidak’s multiple comparisons test (C,D).
|
