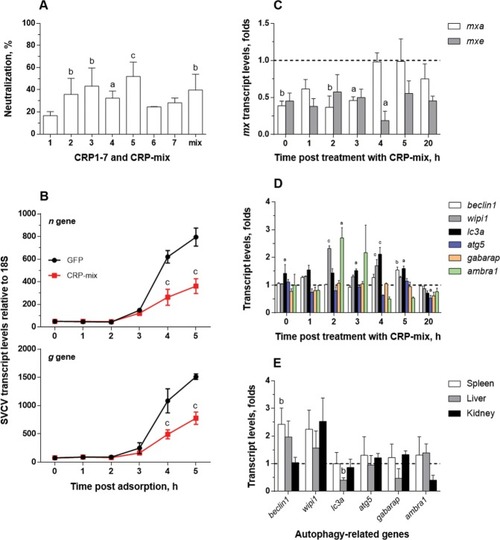
Interaction of CRP1-7 on SVCV replication in ZF4 zebrafish cells. (A) SVCV neutralization of CRP1-7 and CRP-mix when incubated with ZF4 cells for 2 h before virus adsorption. SVCV infection was determined by the focus forming assay. The results are represented as percentages of neutralization. These experiments were performed 3 times each in triplicate. (B) Time course of SVCV replication at early stages post adsorption. SVCV replication levels in ZF4 cells, incubated for 2 h with CRP-mix before viral adsorption, were determined at 0–5 h by measuring the expression of SVCV n and g gene transcripts by RT-qPCR. They are expressed as fold changes. (C) Induction of the IFN system by the CRP-mix. The transcript levels of the two IFN-response reporter gene isoforms of Mx (mxa and mxe) were quantified by RT-qPCR in ZF4 cells treated with the CRP-mix for 2 h before viral infection at different times post adsorption (0–5 and 20 h). The data were normalized to the corresponding 18S ribosomal levels and expressed as in Fig. 2D. (D) Capacity of the CRP-mix to modulate autophagy-related transcripts in vitro. The transcript levels of the relevant autophagy genes (beclin1, wipi1, lc3a, atg5, gabarap and ambra1) were quantified as described in in non-infected ZF4 cells (C). All gene expression studies were performed twice in quadruplicate in vitro. (E) Capacity of the CRP-mix to modulate autophagy-related gene transcripts in vivo. Four (non-infected) adult zebrafish were i.p. injected with the CRP-mix. Two days post injection, the transcript levels of the autophagy-related genes previously analysed in vitro were quantified by RT-qPCR in spleen, liver and kidney tissues. The data were normalized to the corresponding 18S ribosomal levels and expressed as fold changes. All data are presented as the mean and s.d. The statistically significant differences between them are indicated with symbols as indicated in Fig. 1. Data were analysed by using one-way ANOVA (A) and two-way ANOVA (B–D) with Sidak’s multiple comparisons test and multiple Student’s t-tests by the Holm-Sidak method (E).
|
