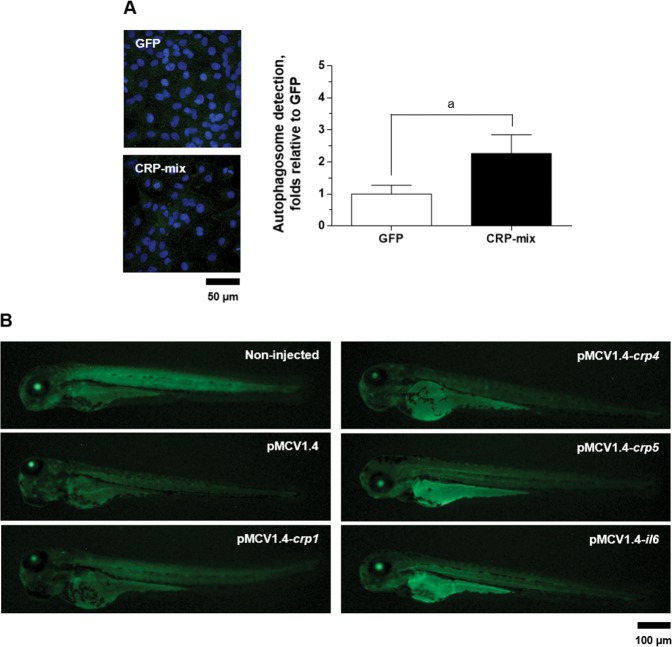
LC3 recruitment by selected CRPs in ZF4 cells and in zebrafish larvae. (A) Representative confocal images of the FITC immune-labelled LC3B in ZF4 cells treated with either GFP or the CRP-mix for 4 h. Nuclei were stained with DAPI. Autophagosome levels were quantified as the area (per cell) of over-threshold green fluorescence corresponding to the intracellular puncta and represented as fold changes in comparison to the GFP treatment as determined by the following formula: over-threshold fluorescence per cell in CRP-mix-treated monolayers/over-threshold fluorescence per cell in GFP-treated monolayers. This experiment was performed 3 times, each in triplicate. Symbol’a’ indicates statistically significant differences between CRP-mix and GFP treatments at the P < 0.05 level. Data were analysed by using two-tailed unpaired Student’s t-test. (B) Representative images of GFP-LC3 transgenic zebrafish larvae at 3 days post injection with 150 pg of pMCV1.4 or pMCV1.4-crp1/crp4/crp5/il6 plasmid constructs. Corresponding scale bars equal 50 and 100 µm.
Acknowledgments
This image is the copyrighted work of the attributed author or publisher, and
ZFIN has permission only to display this image to its users.
Additional permissions should be obtained from the applicable author or publisher of the image.
Full text @ Sci. Rep.
Your Input Welcome
Thank you for submitting comments. Your input has been emailed to ZFIN curators who may contact you if
additional information is required.
Oops. Something went wrong. Please try again later.