FIGURE SUMMARY
Title

Embelin Protects Against Acute Pentylenetetrazole-Induced Seizures and Positively Modulates Cognitive Function in Adult Zebrafish

Authors
Kundap, U.P., Choo, B.K.M., Kumari, Y., Ahmed, N., Othman, I.B., Shaikh, M.F.
Source
Full text @ Front Pharmacol

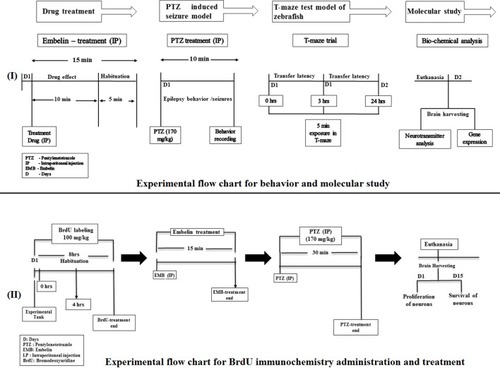
Experimental setup and design procedure. The flowchart represents the scheme for drug treatment, PTZ administration, and behavior recording for epilepsy and T-maze used in the study.

Seizure score and onset latency for epileptic seizures: (A) represents the effect of embelin on PTZ induced seizures in adult zebrafish. (B) represents onset of seizure latency score 4 for EMB and DZP treated fish when compared with PTZ treated group. Data are represented as mean ± SEM, n = 10, and statistically analyzed by one-way ANOVA followed by Dunnett’s test *P ≤0.05, **P ≤ 0.01, and ***P ≤ 0.001.

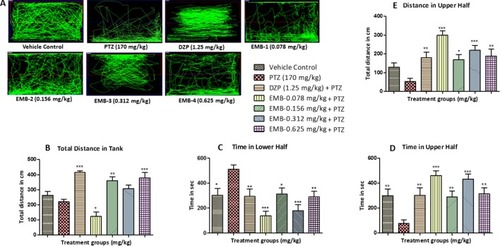
Locomotor pattern and behavior analysis of embelin treatment against pentylenetetrazole (PTZ) induced seizures: (A) represents the tracking pattern of locomotor behavior for the control and PTZ treated and EMB treated groups. (B) represents the total distance traveled by fish in each group during locomotor behavior tracking. (C, D) represent the time spent in total by each fish in the lower and upper half of the behavior tank. (E) represents the total distance traveled in the upper half of the tank. The data are represented as mean ± SEM, n = 10, and statistically analyzed by one-way ANOVA followed by Dunnett’s test *P ≤0.05, **P ≤ 0.01, and ***P ≤ 0.001.

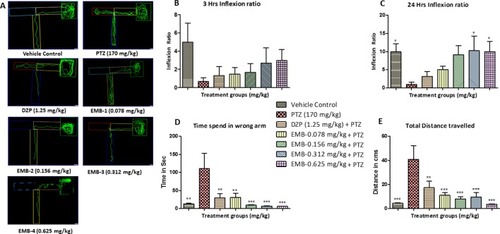
T-maze tracking pattern and behavior analysis of embelin treatment against pentylenetetrazole (PTZ) induced seizures and cognitive dysfunction. (A) represents the T-maze tracking pattern of locomotor behavior for the control and PTZ treated and EMB treated groups. (B, C) represent the graph plot of the inflection ratio at the 3 h and 24 h T-maze trial. (D, E) represents the time spent in the wrong arm and the total distance traveled by each fish to reach the deepest chamber of T-maze behavior tank. Data are represented as mean ± SEM, n = 8, and statistically analyzed by one-way ANOVA followed by Dunnett’s test *P ≤0.05, **P ≤ 0.01, and ***P ≤ 0.001.

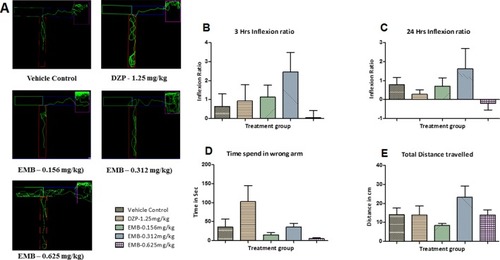
T-maze tracking pattern and behavior analysis of embelin treatment in adult healthy zebrafish: (A) represents the T-maze tracking pattern of locomotor behavior for the control and DZP treated and embelin (EMB) treated groups. (B, C) represent the graph plot of the inflection ratio at 3 and 24 h. T-maze trail in adult healthy zebrafish. (D, E) represent the time spent in the wrong arm and total distance traveled by each fish to reach the deeper chamber of the T-maze in adult healthy zebrafish. Data are represented as mean ± SEM, n = 8, and statistically analyzed by one-way ANOVA followed by Dunnett’s test.

(A) Neurotransmitters analysis in epileptic zebrafish brains after embelin treatment and 24 h. T-maze behavior: (A1) represents concentration of GABA in the zebrafish brain. (A2) represents concentration of glutamate in the zebrafish brain. (A3) represents concentration of acetylcholine (Ach) in the zebrafish brain. Data are represented as mean ± SEM, n = 6, and statistically analyzed by one-way ANOVA followed by Dunnett’s test *P ≤0.05, **P ≤ 0.01, and ***P ≤ 0.001. (B) Neurotransmitters analysis in healthy zebrafish brains after embelin treatment and 24 h T-maze behavior: (B1) represents concentration of GABA in the zebrafish brain. (B2) represents concentration of glutamate in the zebrafish brain. (B3) represents concentration of acetylcholine (Ach) in the zebrafish brain. Data are represented as Mean ± SEM, n = 6, and statistically analyzed by one-way ANOVA followed by Dunnett’s test *P ≤0.05, **P ≤ 0.01, and ***P ≤ 0.001.

(A) Gene expression analysis in epileptic zebrafish brains after embelin treatment and 24 h T-maze behavior: (A1) represents graph plot for BDNF mRNA expression in the zebrafish brain. (A2) represents graph plot of CREB_1 mRNA expression level in the zebrafish brain. (A3) represents graph plot of NPY mRNA expression in the zebrafish brain. Data are represented as mean ± SEM, n = 6, and statistically analyzed by one-way ANOVA followed by Dunnett’s test *P ≤ 0.05, **P ≤ 0.01, and ***P ≤ 0.001. (B) Gene expression analysis in adult healthy zebrafish brains after embelin treatment and 24 h T-maze behavior: (B1) represents graph plot for BDNF mRNA expression in the zebrafish brain. (B2) represents graph plot of CREB_1 mRNA expression level in the zebrafish brain. (B3) represents graph plot of NPY mRNA expression in the zebrafish brain. Data are represented as mean ± SEM, n = 6, and statistically analyzed by one-way ANOVA followed by Dunnett’s test *P ≤ 0.05, **P ≤ 0.01, and ***P ≤ 0.001.

(A) Docking study of embelin with respect to diazepam and the GABAA receptor. (B) Proposed mechanism of action of embelin at the GABAA receptor to reverse PTZ induced seizures. 8B1—During a seizure, a prolonged opening of the voltage-gated Na+ channel causes an influx of sodium ions which leads to depolarization and repetitive neuronal firing. The opening of Ca2+ channels increases the influx of positive calcium ions causing prolonged spikes and T current waves. As there is no affinity for the GABAA receptor, the decreased Cl influx causes epileptic excitation inside the neuron cell. 8B2—EMB shows higher affinity for GABAA receptor binding; it facilitates GABA mediated Cl channel opening with cell hyperpolarization and reduced seizure frequency, prolonged inactivation of the voltage-gated neuronal Na+ channel, prevented intracellular Na+ accumulation, reduced Ca2+ influx, and inhibited glutamate.

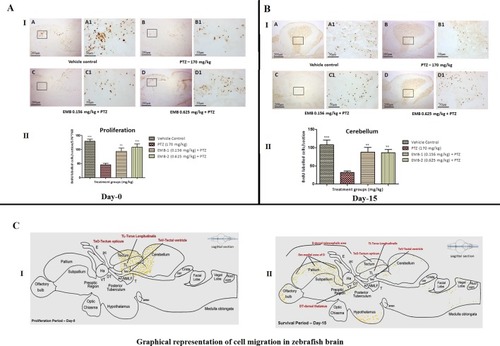
(A) BrdU immunohistochemistry analysis of the protective effects of embelin at the proliferation (day 0) and survival (day 15) stage against pentylenetetrazole-induced epilepsy the zebrafish brain. (A I) BrdU-positive staining revealed labeling of mitotic cells of immature neurons in the subgranular zone of the periventricular gray zone of tectum opticum with BrdU. Photomicrographs of the sagittal section of treatment groups were (A) control, (B) PTZ 170 mg/kg, (C) EMB 0.156 mg/kg + PTZ, and (D) EMB 0.625 mg/kg + PTZ. Representative photomicrographs were taken at magnifications of 40X and 200X. (II) Quantification of BrdU positive cells. Data are expressed as means mean ± SEM, n = 6, and statistical analysis by one-way ANOVA followed by Dunnett’s test ∗∗P < 0.01, and ***P < 0.001. (A II) BrdU immunohistochemistry analysis of the effects of embelin in improving neurogenesis and migration of cells generated during 15 days from the molecular layer to the granular layer within the dorsal zone of the periventricular hypothalamus against pentylenetetrazole-induced epilepsy the zebrafish brain. (I) BrdU-positive staining revealed labeling and migration of cells at day 15 of cell maturation and differentiation stage within the valvula cerebelli zone of cerebellum with BrdU labeling. Photomicrographs of the sagittal section of treatment groups were (A) control, (B) PTZ 170 mg/kg alone, (C) EMB 0.156 mg/kg + PTZ, and (D) EMB 0.625 mg/kg + PTZ. Representative photomicrographs were taken at magnifications of 40X and 100X. (II) Quantification of BrdU population: Data are expressed as mean ± SEM, n = 6, and statistical analysis by one-way ANOVA followed by Dunnett’s test ∗∗P < 0.01, and ∗∗∗P < 0.001. (B) Graphical representation of cell migration in zebrafish brain. (I) represents location of positive BrdU cells at day 0. (II) represents migration and location of positive BrdU cells at day 15.

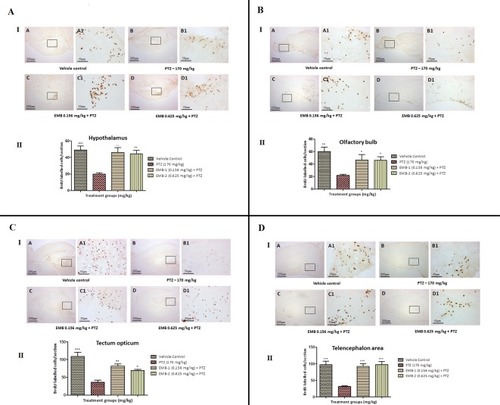
BrdU immunohistochemistry analysis of the effects of embelin in improving neurogenesis and migration of cells generated during adulthood from the molecular layer to the granular layer within the molecular zone of the hypothalamus, the internal cellular layer of the olfactory bulb of the periventricular gray zone of TeO, and the medial zone of the dorsal telencephalic area against pentylenetetrazole-induced epilepsy the zebrafish brain. (I) BrdU-positive staining revealed labeling and number of migration of cells at day 15 of maturation and differentiation stage at the molecular zone of each section of zebrafish brain with BrdU labeling. Photomicrographs of the sagittal section of treatment groups were (A) control, (B) PTZ 170 mg/kg alone, (C) EMB 0.156 mg/kg + PTZ, and (D) EMB 0.625 mg/kg + PTZ. Representative photomicrographs were taken at magnifications of 40X and 100X. (II) Quantification of BrdU population: Data are expressed as mean ± SEM, n = 6, and statistical analysis by one-way ANOVA followed by Dunnett’s test *P < 0.05, **P < 0.01, and ***P < 0.001.

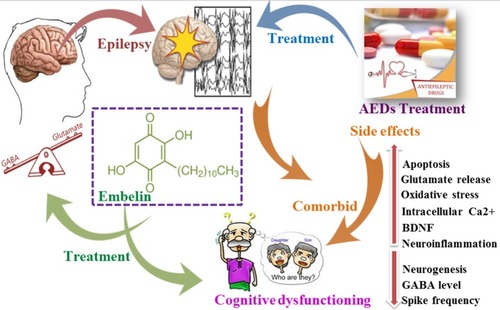
Impact of epilepsy and antiepileptic drugs on cognitive dysfunction.

Acknowledgments
This image is the copyrighted work of the attributed author or publisher, and ZFIN has permission only to display this image to its users. Additional permissions should be obtained from the applicable author or publisher of the image. Full text @ Front Pharmacol