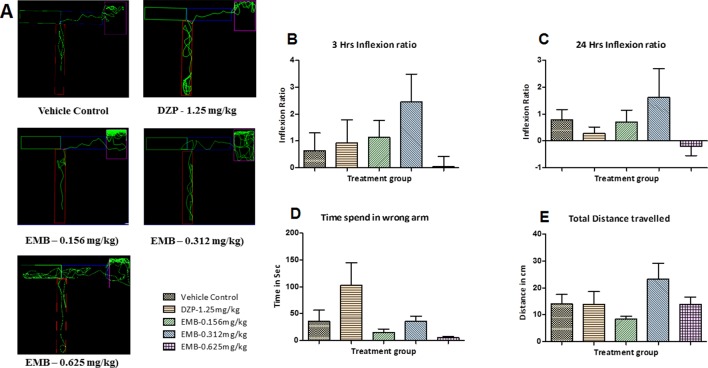
T-maze tracking pattern and behavior analysis of embelin treatment in adult healthy zebrafish: (A) represents the T-maze tracking pattern of locomotor behavior for the control and DZP treated and embelin (EMB) treated groups. (B, C) represent the graph plot of the inflection ratio at 3 and 24 h. T-maze trail in adult healthy zebrafish. (D, E) represent the time spent in the wrong arm and total distance traveled by each fish to reach the deeper chamber of the T-maze in adult healthy zebrafish. Data are represented as mean ± SEM, n = 8, and statistically analyzed by one-way ANOVA followed by Dunnett’s test.
Acknowledgments
This image is the copyrighted work of the attributed author or publisher, and
ZFIN has permission only to display this image to its users.
Additional permissions should be obtained from the applicable author or publisher of the image.
Full text @ Front Pharmacol
Your Input Welcome
Thank you for submitting comments. Your input has been emailed to ZFIN curators who may contact you if
additional information is required.
Oops. Something went wrong. Please try again later.