FIGURE SUMMARY
Title

Transcriptome profiling analysis of sex-based differentially expressed mRNAs and lncRNAs in the brains of mature zebrafish (Danio rerio)

Authors
Yuan, W., Jiang, S., Sun, D., Wu, Z., Wei, C., Dai, C., Jiang, L., Peng, S.
Source
Full text @ BMC Genomics

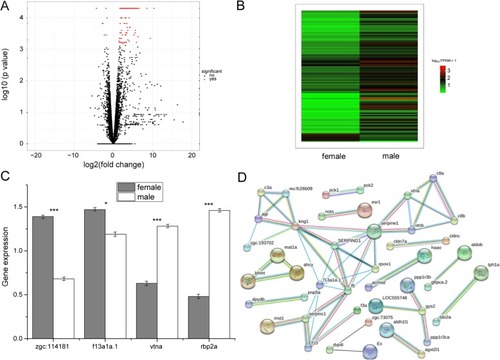
Characterization and verification of differentially expressed genes. a Volcano plots obtained by using fold-change values and P-values; (b) Hierarchical clustering analysis of mRNAs that are differentially expressed between the female and male zebrafish samples. Each group contains three individuals and the expression values are represented in different colors; (c) Significantly differentially expressed genes by RT-qPCR. Gray and white bars represent the female and males, respectively. The error bars represent standard error (***, P < 0.001; and *, P = 0.05); and (d) Protein-protein interaction network. The green edges represent gene neighborhood, the red edges represent gene fusions, the blue edges represent gene co-occurrence, the black edges represent gene co-expression, and the yellow edges represent text mining

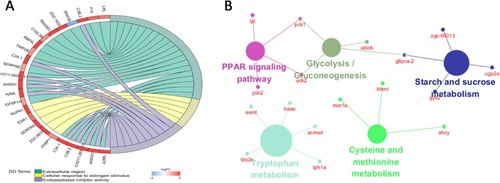
GO and KEGG analyses of differentially expressed genes. a GO enrichment analysis of the differentially expressed genes. Different colors represent the different GO classification entries; (b) Enriched pathway of the differentially expressed genes. The dots represent the genes, and the elliptical nodes represent the enriched pathway

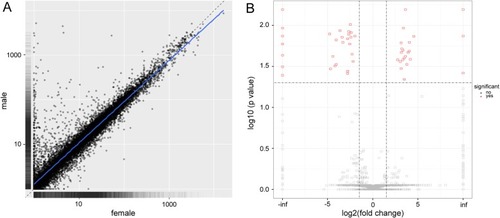
Characterization and verification of the differentially expressed lncRNAs. a the scatter plot of the lncRNA expression in the female and male zebrafish samples; (b) The volcano plots analysis of the lncRNAs that are differentially expressed between the female and male zebrafish samples. Inf indicates that the FPKM value of the gene in female zebrafish is 0. -inf indicates that the FPKM value of the gene in male zebrafish is 0

(a) LncRNAs-gene co-expression networks. A red circle represents a gene, whereas a blue diamond represents a lncRNA; (b) GO analysis of mRNA in co-expressed networks; (c) Expression of HSPA8P5 in several human diseases, data from TCGA database

Acknowledgments
This image is the copyrighted work of the attributed author or publisher, and ZFIN has permission only to display this image to its users. Additional permissions should be obtained from the applicable author or publisher of the image. Full text @ BMC Genomics