
Image
|
Figure Caption
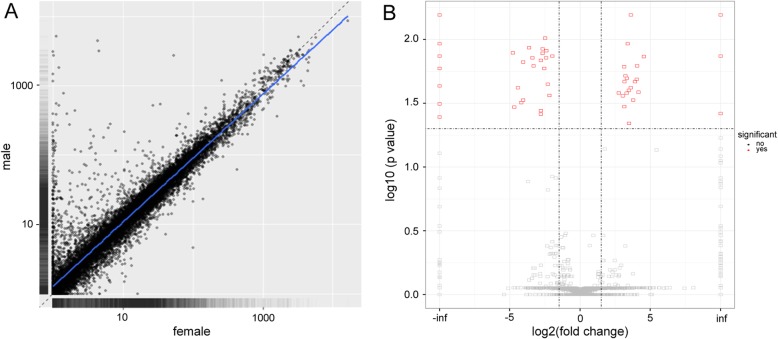
Fig. 3
Characterization and verification of the differentially expressed lncRNAs. a the scatter plot of the lncRNA expression in the female and male zebrafish samples; (b) The volcano plots analysis of the lncRNAs that are differentially expressed between the female and male zebrafish samples. Inf indicates that the FPKM value of the gene in female zebrafish is 0. -inf indicates that the FPKM value of the gene in male zebrafish is 0
Acknowledgments
This image is the copyrighted work of the attributed author or publisher, and
ZFIN has permission only to display this image to its users.
Additional permissions should be obtained from the applicable author or publisher of the image.
Full text @ BMC Genomics