IMAGE

Fig. 1

ID
ZDB-IMAGE-191230-940
Source
Figures for Yuan et al., 2019
Image
Figure Caption

Fig. 1

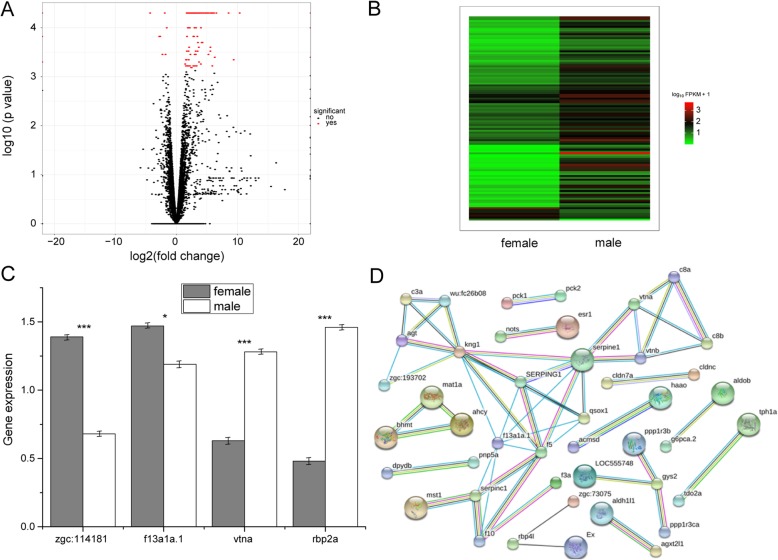
Characterization and verification of differentially expressed genes. a Volcano plots obtained by using fold-change values and P-values; (b) Hierarchical clustering analysis of mRNAs that are differentially expressed between the female and male zebrafish samples. Each group contains three individuals and the expression values are represented in different colors; (c) Significantly differentially expressed genes by RT-qPCR. Gray and white bars represent the female and males, respectively. The error bars represent standard error (***, P < 0.001; and *, P = 0.05); and (d) Protein-protein interaction network. The green edges represent gene neighborhood, the red edges represent gene fusions, the blue edges represent gene co-occurrence, the black edges represent gene co-expression, and the yellow edges represent text mining

Acknowledgments
This image is the copyrighted work of the attributed author or publisher, and ZFIN has permission only to display this image to its users. Additional permissions should be obtained from the applicable author or publisher of the image. Full text @ BMC Genomics