
FIGURE
Fig. 4
- ID
- ZDB-FIG-191230-927
- Publication
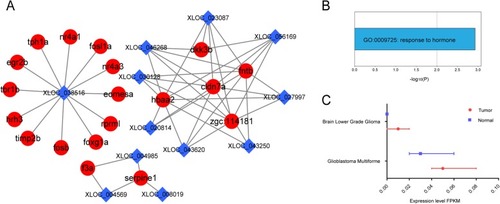
- Yuan et al., 2019 - Transcriptome profiling analysis of sex-based differentially expressed mRNAs and lncRNAs in the brains of mature zebrafish (Danio rerio)
- Other Figures
- All Figure Page
- Back to All Figure Page
Fig. 4
( |
Expression Data
Expression Detail
Antibody Labeling
Phenotype Data
Phenotype Detail
Acknowledgments
This image is the copyrighted work of the attributed author or publisher, and
ZFIN has permission only to display this image to its users.
Additional permissions should be obtained from the applicable author or publisher of the image.
Full text @ BMC Genomics