Influence of solvent ethanol to lethality and morphology of zebrafish larvae.

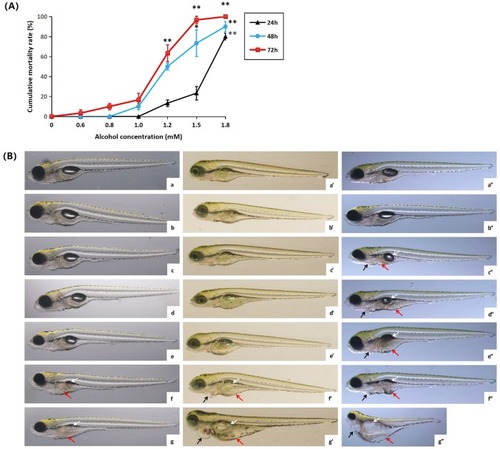
(A) Lethality of solvent ethanol to zebrafish after exposure of 24, 48 and 72h at different ethanol concentrations. The experiment was repeated for three times, with 30 zebrafish larvae in each group. Baseline adjusted values (mean±SD) are presented. *P<0.05,**P<0.01 versus control. (B) Influence of solvent ethanol to the morphology of zebrafish larvae after exposure for 24 h (a, b, c, d, e, f and g), 48 h (a’, b’, c’, d’, e’, f’ and g’) and 72 h(a”, b”, c”, d”, e”, f” and g”) at blank (a, a’ and a”) and at the ethanol concentrations of 0.6 mM(b, b’ and b”), 0.8 mM(c, c’ and c”), 1.0 mM(d, d’ and d”), 1.2 mM(e, e’ and e”), 1.5 mM(f, f’ and f”) and 1.8 mM(g, g’ and g”). Swim bladder reduction of zebrafish larvae was pointed out by the white arrow, yolk sac edema was pointed out by the red arrow, and pericardium edema was pointed out by the black arrow.

Influence of solvent ethanol to liver tissue of zebrafish larvae.

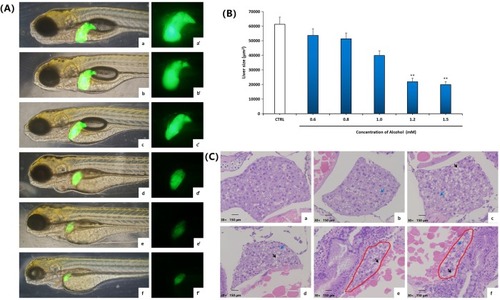
Morphological observation of liver after the liver green fluorescence transgene zebrafish T3 (lfabp:EGFP) is exposed for 72h at blank (a and a’) and at ethanol concentrations of 0.6 mM(b and b’), 0.8 mM(c and c’), 1.0 mM(d and d’), 1.2 mM(e and e’) and 1.5 mM(f and f’). (A) Test of fluorescence intensity of zebrafish larvae liver in figure 2A with Image-Pro Plus 6.0 software. At least 3 zebrafish were tested in each group of concentration. Baseline adjusted values (mean±SEM) are presented. *P<0.05,**P<0.01 versus control. (B) Pathological observation of zebrafish liver tissue treated in blank (a) and various ethanol concentrations of 0.6 mM (b), 0.8 mM (c), 1.0 mM (d), 1.2 mM (e) and 1.5 mM (f), respectively. The liver part was marked with a red circle. Liver cell fatty degeneration was pointed out by the black arrow. Microvesicular lipid droplets in the liver cell were pointed out by the blue arrow.

Influence of <italic>lactobacillus plantarum</italic> on morphology of zebrafish larvae.

After 24 h of 1.0 mM alcohol injury, replaced ethanol solution with ethanol solution containing LPS with dosages of 1.0×10⁵ cfu/mL (a), 1.0×10⁶ cfu/mL (b), 1.0×10⁷ cfu/mL (c) and 1.5×10⁷ cfu/mL(d) or LPBS with dosages of 1.0×10⁵ cfu/mL (e), 1.0×10⁶ cfu/mL (f), 1.0×10⁷ cfu/mL (g) and 1.5×10⁷ cfu/mL(h) for repair for 48 h, and observe the morphological change of the zebrafish larvae. The liver part was marked with a red circle. Swim bladder reduction of the zebrafish larvae was pointed out by the white arrow, and yolk sac edema was pointed out by the red arrow.

Influence of <italic>lactobacillus plantarum</italic> to liver tissue of zebrafish larvae.

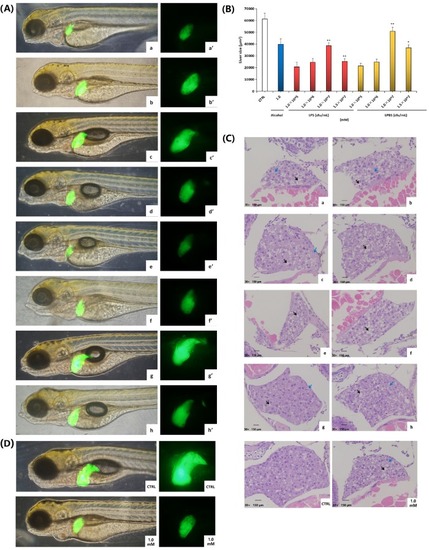
Morphological observation of zebrafish liver after the liver green fluorescence transgene T3 (lfabp:EGFP) was exposed for 48 h at LPS concentrations of 1.0×10⁵ cfu/mL (a and a’), 1.0×10⁶ cfu/mL (b and b’), 1.0×10⁷ cfu/mL (c and c’) and 1.5×10⁷ cfu/mL(d and d’), and LPBS concentrations of 1.0×10⁵ cfu/mL (e and e’), 1.0×10⁶ cfu/mL (f and f’), 1.0×10⁷ cfu/mL (g and g’) and 1.5×10⁷ cfu/mL(h and h’). (A) Test of fluorescence intensity of zebrafish larvae liver in figure 4A with Image-Pro Plus 6.0 software. At least 3 zebrafish were tested in each group of concentration. Baseline adjusted values (mean ± SEM) are presented. *P<0.05,**P<0.01 versus control. (B) Pathological observation of zebrafish liver tissue treated with LPS with dosages of 1.0×10⁵ cfu/mL (a), 1.0×10⁶ cfu/mL (b), 1.0×10⁷ cfu/mL (c) and 1.5×10⁷ cfu/mL(d), or LPBS with dosages of 1.0×10⁵ cfu/mL (e), 1.0×10⁶ cfu/mL (f), 1.0×10⁷ cfu/mL (g) and 1.5×10⁷ cfu/mL(h), respectively. Liver cell fatty degeneration was pointed out by the black arrow. Microvesicular lipid droplets in the liver cell were pointed out by the blue arrow. (C) The liver fluorescence intensity and the pathological observation of liver tissue of zebrafish of control group and 1.0 mM alcohol group.

Acknowledgments
This image is the copyrighted work of the attributed author or publisher, and ZFIN has permission only to display this image to its users. Additional permissions should be obtained from the applicable author or publisher of the image. Full text @ PLoS One