IMAGE

Fig 2

ID
ZDB-IMAGE-191230-267
Source
Figures for Liu et al., 2019
Image
Figure Caption

Fig 2 Influence of solvent ethanol to liver tissue of zebrafish larvae.

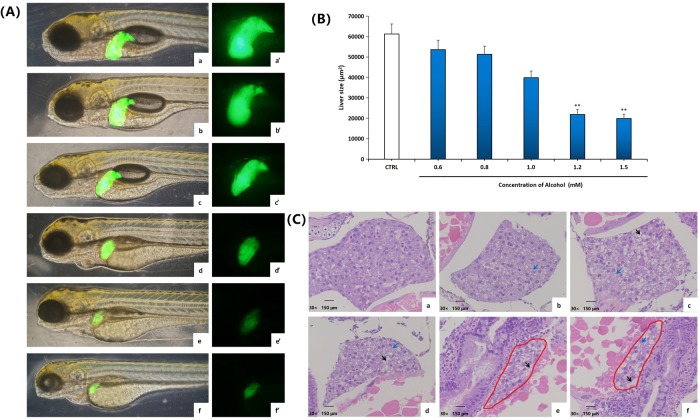
Morphological observation of liver after the liver green fluorescence transgene zebrafish T3 (lfabp:EGFP) is exposed for 72h at blank (a and a’) and at ethanol concentrations of 0.6 mM(b and b’), 0.8 mM(c and c’), 1.0 mM(d and d’), 1.2 mM(e and e’) and 1.5 mM(f and f’). (A) Test of fluorescence intensity of zebrafish larvae liver in figure 2A with Image-Pro Plus 6.0 software. At least 3 zebrafish were tested in each group of concentration. Baseline adjusted values (mean±SEM) are presented. *P<0.05,**P<0.01 versus control. (B) Pathological observation of zebrafish liver tissue treated in blank (a) and various ethanol concentrations of 0.6 mM (b), 0.8 mM (c), 1.0 mM (d), 1.2 mM (e) and 1.5 mM (f), respectively. The liver part was marked with a red circle. Liver cell fatty degeneration was pointed out by the black arrow. Microvesicular lipid droplets in the liver cell were pointed out by the blue arrow.

Acknowledgments
This image is the copyrighted work of the attributed author or publisher, and ZFIN has permission only to display this image to its users. Additional permissions should be obtained from the applicable author or publisher of the image. Full text @ PLoS One