|
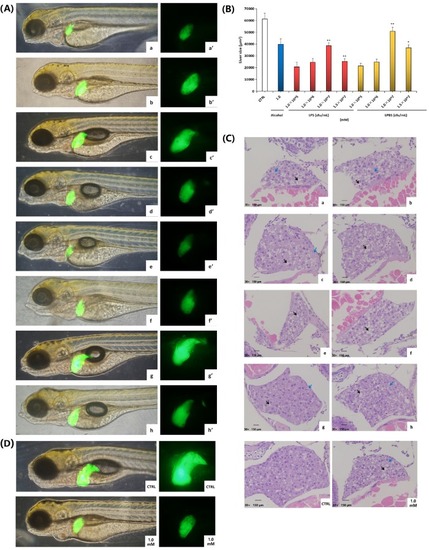
Influence of <italic>lactobacillus plantarum</italic> to liver tissue of zebrafish larvae.Morphological observation of zebrafish liver after the liver green fluorescence transgene T3 (lfabp:EGFP) was exposed for 48 h at LPS concentrations of 1.0×10⁵ cfu/mL (a and a’), 1.0×10⁶ cfu/mL (b and b’), 1.0×10⁷ cfu/mL (c and c’) and 1.5×10⁷ cfu/mL(d and d’), and LPBS concentrations of 1.0×10⁵ cfu/mL (e and e’), 1.0×10⁶ cfu/mL (f and f’), 1.0×10⁷ cfu/mL (g and g’) and 1.5×10⁷ cfu/mL(h and h’). (A) Test of fluorescence intensity of zebrafish larvae liver in figure 4A with Image-Pro Plus 6.0 software. At least 3 zebrafish were tested in each group of concentration. Baseline adjusted values (mean ± SEM) are presented. *P<0.05,**P<0.01 versus control. (B) Pathological observation of zebrafish liver tissue treated with LPS with dosages of 1.0×10⁵ cfu/mL (a), 1.0×10⁶ cfu/mL (b), 1.0×10⁷ cfu/mL (c) and 1.5×10⁷ cfu/mL(d), or LPBS with dosages of 1.0×10⁵ cfu/mL (e), 1.0×10⁶ cfu/mL (f), 1.0×10⁷ cfu/mL (g) and 1.5×10⁷ cfu/mL(h), respectively. Liver cell fatty degeneration was pointed out by the black arrow. Microvesicular lipid droplets in the liver cell were pointed out by the blue arrow. (C) The liver fluorescence intensity and the pathological observation of liver tissue of zebrafish of control group and 1.0 mM alcohol group.
|