
- Title
-
Inhibition of amyloid beta toxicity in zebrafish with a chaperone-gold nanoparticle dual strategy
- Authors
- Javed, I., Peng, G., Xing, Y., Yu, T., Zhao, M., Kakinen, A., Faridi, A., Parish, C.L., Ding, F., Davis, T.P., Ke, P.C., Lin, S.
- Source
- Full text @ Nat. Commun.
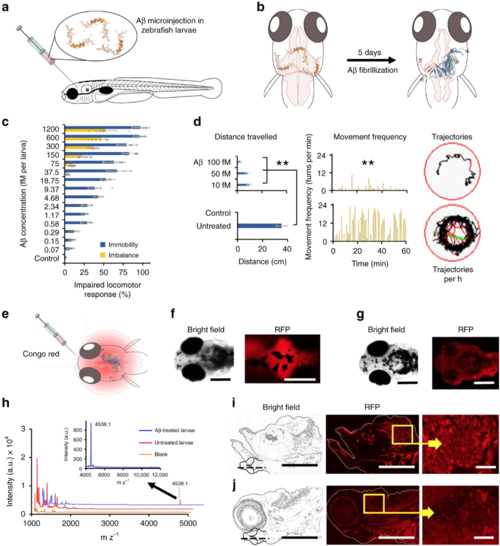
Aβ toxicity in zebrafish (Danio rerio) larvae. a Five-day-old zebrafish larvae were treated with Aβ and developed pathological symptoms (b). c Disruptive locomotive behavior was recorded in terms of percentage of larvae who failed to respond upon tapping (blue bars) and unable to maintain horizontal swimming position (orange bars) (n = 10). d The behavior of the larvae was further recorded on an automated zebrafish behavior monitoring system for 1 h at 5 days post Aβ treatment (n = 10). Total distance traveled along with movement frequency was significantly decreased compared to untreated control (p < 0.005). Representative trajectories of 100 fM Aβ treated and untreated larvae inside a single well of a 96-well plate, during 1 h of observation. e Five days after Aβ (100 fM) treatment, larvae were further treated with Congo red (100 fM) via cerebroventricular injection. Whole mount larvae were imaged under the RFP channel 6 h after Aβ treatment. f Significant fluorescence was retained in the cereberal region of larvae on the fifth day post Aβ treatment. g Congo red injected in untreated larva was not retained in the cerebral region. h MALDI detection of Aβ in the brain of zebrafish larvae, 5 days post Aβ injection (n = 10, Mean ± SD). Five days after cerebroventricular injection of Aβ, the heads of zebrafish larvae were excised after euthanization. The heads were homogenized in Holtfreter’s buffer and subjected to MALDI-TOF/TOF analysis. Peak corresponding to Aβ molecular weight was observed at 4538.1 mz−1. Untreated larvae and matrix alone were used as controls. iCongo red-stained thin section (sagittal) of Aβ treated larvae brain tissue. Bright red spots were observed in the cerebral region of larvae, corresponding to the Aβ amyloid or plaque formation. j In thin sections of the brain tissue of untreated larvae (negative control), no red spots were observed. Scale bars in all images are 200 µM, while in i and j inset are 20 µM. Error bars represent the standard deviation. Source data are provided as a Source Data file |
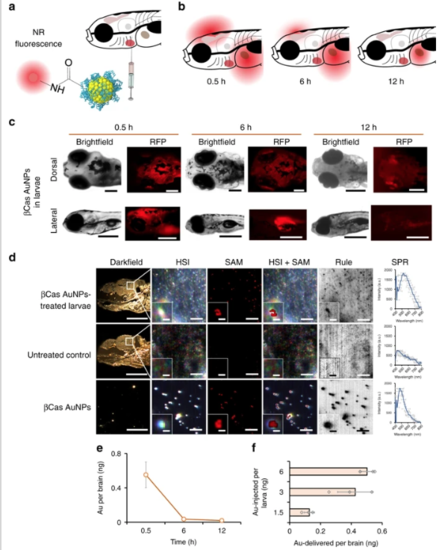
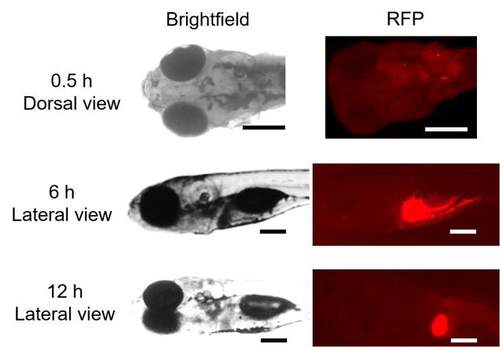
In vivo biodistribution of βCas AuNPs in zebrafish larvae. a βCas AuNPs were conjugated with neutral red and injected to zebrafish larvae (5 day old) via the intracardiac route in a dose equivalent to 3 ng Au per 4.5 ng βCas. b Labeled βCas AuNPs were traced for in vivo distribution at 0.5, 6, and 12 h in dorsal and lateral positions (c). Bright fluorescence was observed from the brain 0.5 h after AuNP administration. However, fluorescence was eliminated from the cerebral region in 6 h, while it took 12 h to eliminate from the body (scale bars: 200 µM). d Tissue microtome of zebrafish brain was subjected to HSI imaging. Spectral angular mapping (SAM) images were built from HSI by scanning against the βCas AuNPs spectral library. SAM and Rule images colored the pixels as red and black, respectively, that have matching spectra of βCas AuNPs. Zebrafish larvae with βCas AuNPs in the brain presented black spots in Rule images and red pixels in SAM images. SPR spectra with peak ~530 nm were observed in the brain of βCas AuNPs treated larvae. No such spectra were recorded for control larva (scale bars: darkfield 200 µM; HSI, SAM, HSI + SAM, Rule: 10 µM; inset scale bar: 2 µM; scale bar for βCas AuNPs: 10 µM, inset scale bar: 0.5 µM). e ICP MS analysis, where the AuNP concentration was the highest in the larval brain at 0.5 h, i.e., equivalent to 0.6 ± 0.1 ng of Au, and dropped to 0.05 ± 0.01 and 0.02 ± 0.008 ng at 6 and 12 h, respectively (n = 10). f Dose–response relationship between the amount of AuNPs injected vs. the amount of AuNPs delivered across the brain (n = 10). Significantly (p < 0.05) increased amount of Au was delivered when intracardiac dose of AuNPs was increased from 1.5 to 3 ng equivalent. However, increasing the dose from 3 to 6 ng did not improve AuNP delivery across the BBB, indicating a dose saturation. Error bars represent the standard deviation. |
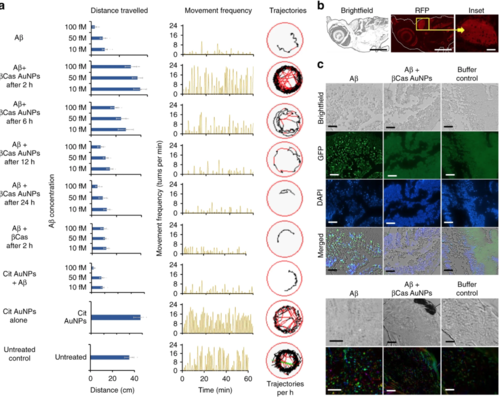
Mitigation of Aβ toxicity in zebrafish larvae with βCas AuNPs. a Aβ peptide was injected into the cerebroventricular space at 10, 50, and 100 fM concentrations (n = 20, mean ± SD). Zebrafish larvae were monitored on an automated behavior monitoring system at fifth day post Aβ treatment and parameters of total distance traveled, movement frequency and trajectory path were observed for 1 h. Significant (p < 0.005) difference in the behavior of the larvae was observed on the fifth day post treatment. βCas AuNPs injected, via the intracardiac route 2 and 6 h after the Aβ treatment, rescued the larvae from Aβ toxicity and from developing Alzheimer’s-like symptoms. Representative trajectories of the larvae are displayed in the far-right column. Treating the larvae with βCas AuNPs, 12 and 24 h post Aβ treatment, failed to protect the larvae from developing Aβ toxicity. b Zebrafish larvae, treated with βCas AuNPs 2 h after Aβ treatment were fixed, sliced and stained with Congo red to image any Aβ fibrils that could have formed. Tissue slices of the brain section did not present any red fluorescence, indicating no Aβ fibril formation in βCas AuNPs treated larvae (scale bars: 200 µM; inset scale bar: 20 µM). Furthermore, immunohistochemistry (IHC) (c) and polarized light microscopy (apple green birefringence of amyloid) (d) revealed deposition of aggregated Aβ in the larval brain while no Aβ deposition was observed in βCas AuNPs or buffer treated larvae (Scale bars: IHC, 30 µM; polarized light microscopy, 50 µM). Error bars represent the standard deviation |
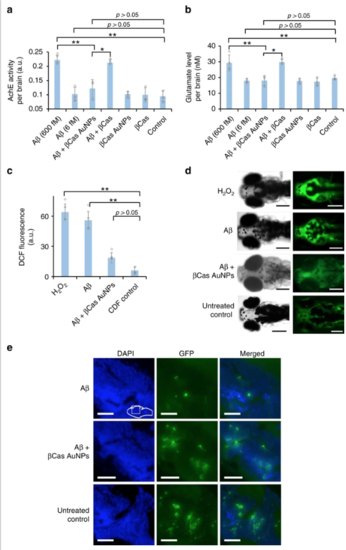
Neurotransmitters and reactive oxygen species (ROS) in the brain of Aβ treated larvae. The biomarkers were measured 5 days post Aβ treatment. Cerebrovascular injection of Aβ peptide at 6 fM per larvae did not significantly (p > 0.05) influence the AchE (a) and GLT (b) levels in zebrafish larvae (n = 10). However, increasing the Aβ dose to 600 fM significantly increased (p < 0.05) AchE and GLT levels. βCas AuNPs (3 ng Au per 4.5 ng βCas), injected 2 h post Aβ treatment, significantly (p < 0.005) reduced the AchE and GLT levels on the 5th day post Aβ (600 fM) treatment. βCas micelles (dose equivalent to βCas in 3 ng βCas AuNPs), in comparison, failed to improve (p > 0.05) the biomarker levels. c ROS generation was significantly (p < 0.005) high in Aβ treated (600 fM) larvae. ROS generation was supressed in βCas AuNPs treated larvae and close to control (n = 10). dRepresentative images of zebrafish larvae expressing DCF/ROS fluorescence when treated with H2O2, Aβ, Aβ + βCas AuNPs, and Aβ + βCas. e Larvae’s brain sections were stained for synaptophysin. Aβ-treated larvae presented loss of synaptophysin indicating neurodegeneration. Scale bars in all images are 200 µM. Error bars represent the standard deviation. |
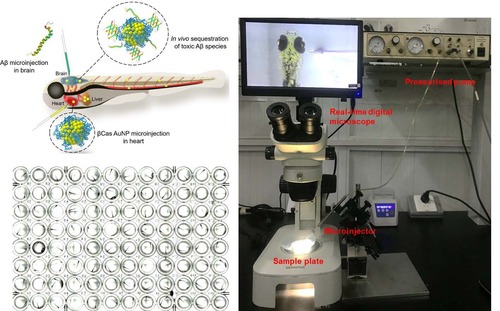
High-throughput setup for Aβ microinjection with zebrafish larvae |
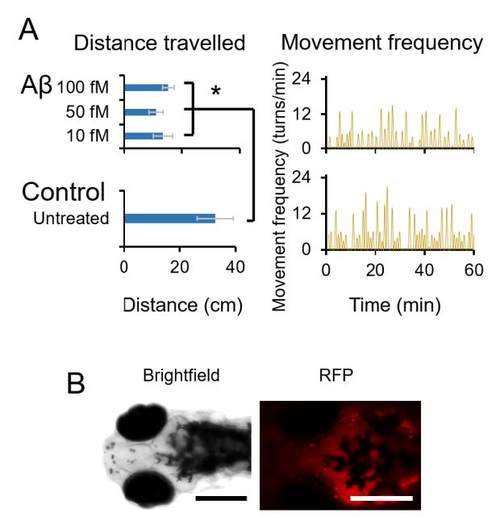
Behavioral changes in zebrafish larvae on the 3rd day post Aβ treatment. (A) Zebrafish larvae swimming behavior was supressed significantly (p<0.05) on the 3rd day post Aβ treatment. Swimming distance was reduced to 13.5 ± 3.3, 11.1 ± 2.4 and 15.4 ± 1.9 cm with 10, 50 and 100 fM Aβ as compared to 35.3 ± 4.3 cm of untreated control (n=3). (B) Aβ treated larvae were injected with Congo red dye on the 3rd day post Aβ treatment and slight retention of the dye was observed in the brain. Scale bars in the images are 300 μm. Error bars represent the standard deviation. Source data are provided as a Source Data file. |
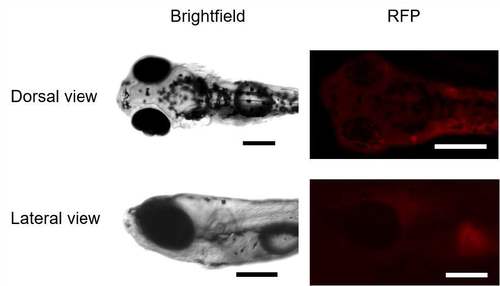
Dorsal and lateral view of untreated zebrafish larvae under brightfield and RF channel of microscope. It indicates no background fluorescence in the larvae to interfere with the other fluorescence measurements. Scale bars in all images are 200 μm |
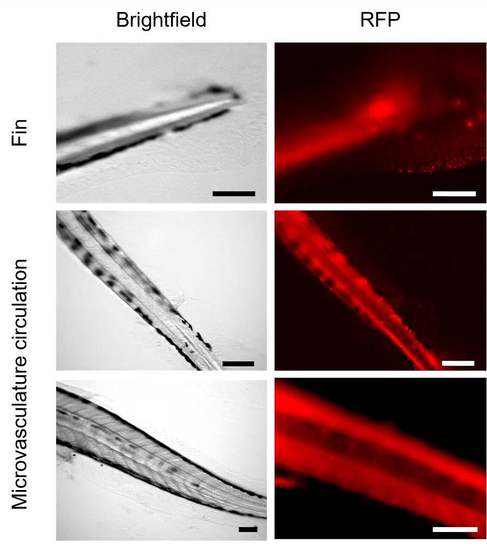
Biodistribution of βCas AuNPs. βCas AuNPs were conjugated with neutral red and imaged for their biodistribution in zebrafish larvae. Red fluorescence of βCas AuNPs was traced in microvasculature circulation and fins of the larvae. Scale bars in the images are 200 μm. |
Biodistribution of βCas micelles in zebrafish larvae. βCas micelles were conjugated with neutral red and imaged for their biodistribution in zebrafish larvae. No fluorescence was observed from the larval cerebral region in 0.5 h or later, indicating inability of large βCas micelles (~100 nm) to translocate across the BBB. Red fluorescence was observed from the hepatic region of the larvae at 6 and 12 h, indicating slow elimination of βCas micelles directly from the liver. Scale bars in images are 200 μm. |