
|
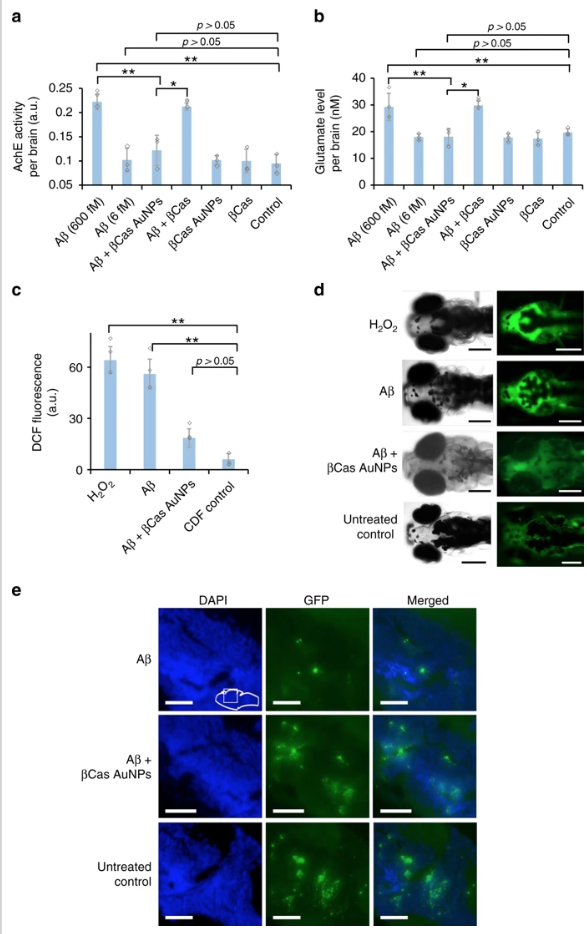
Fig. 6
Neurotransmitters and reactive oxygen species (ROS) in the brain of Aβ treated larvae. The biomarkers were measured 5 days post Aβ treatment. Cerebrovascular injection of Aβ peptide at 6 fM per larvae did not significantly (p > 0.05) influence the AchE (a) and GLT (b) levels in zebrafish larvae (n = 10). However, increasing the Aβ dose to 600 fM significantly increased (p < 0.05) AchE and GLT levels. βCas AuNPs (3 ng Au per 4.5 ng βCas), injected 2 h post Aβ treatment, significantly (p < 0.005) reduced the AchE and GLT levels on the 5th day post Aβ (600 fM) treatment. βCas micelles (dose equivalent to βCas in 3 ng βCas AuNPs), in comparison, failed to improve (p > 0.05) the biomarker levels. c ROS generation was significantly (p < 0.005) high in Aβ treated (600 fM) larvae. ROS generation was supressed in βCas AuNPs treated larvae and close to control (n = 10). dRepresentative images of zebrafish larvae expressing DCF/ROS fluorescence when treated with H2O2, Aβ, Aβ + βCas AuNPs, and Aβ + βCas. e Larvae’s brain sections were stained for synaptophysin. Aβ-treated larvae presented loss of synaptophysin indicating neurodegeneration. Scale bars in all images are 200 µM. Error bars represent the standard deviation.