
Fig. 3
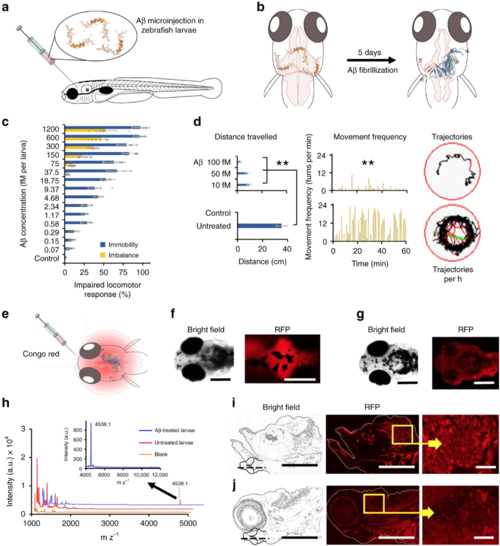
Aβ toxicity in zebrafish (Danio rerio) larvae. a Five-day-old zebrafish larvae were treated with Aβ and developed pathological symptoms (b). c Disruptive locomotive behavior was recorded in terms of percentage of larvae who failed to respond upon tapping (blue bars) and unable to maintain horizontal swimming position (orange bars) (n = 10). d The behavior of the larvae was further recorded on an automated zebrafish behavior monitoring system for 1 h at 5 days post Aβ treatment (n = 10). Total distance traveled along with movement frequency was significantly decreased compared to untreated control (p < 0.005). Representative trajectories of 100 fM Aβ treated and untreated larvae inside a single well of a 96-well plate, during 1 h of observation. e Five days after Aβ (100 fM) treatment, larvae were further treated with Congo red (100 fM) via cerebroventricular injection. Whole mount larvae were imaged under the RFP channel 6 h after Aβ treatment. f Significant fluorescence was retained in the cereberal region of larvae on the fifth day post Aβ treatment. g Congo red injected in untreated larva was not retained in the cerebral region. h MALDI detection of Aβ in the brain of zebrafish larvae, 5 days post Aβ injection (n = 10, Mean ± SD). Five days after cerebroventricular injection of Aβ, the heads of zebrafish larvae were excised after euthanization. The heads were homogenized in Holtfreter’s buffer and subjected to MALDI-TOF/TOF analysis. Peak corresponding to Aβ molecular weight was observed at 4538.1 mz−1. Untreated larvae and matrix alone were used as controls. iCongo red-stained thin section (sagittal) of Aβ treated larvae brain tissue. Bright red spots were observed in the cerebral region of larvae, corresponding to the Aβ amyloid or plaque formation. j In thin sections of the brain tissue of untreated larvae (negative control), no red spots were observed. Scale bars in all images are 200 µM, while in i and j inset are 20 µM. Error bars represent the standard deviation. Source data are provided as a Source Data file |