
FIGURE SUMMARY
- Title
-
The Henna pigment Lawsone activates the Aryl Hydrocarbon Receptor and impacts skin homeostasis
- Authors
- Lozza, L., Moura-Alves, P., Domaszewska, T., Lage Crespo, C., Streata, I., Kreuchwig, A., Puyskens, A., Bechtle, M., Klemm, M., Zedler, U., Silviu Ungureanu, B., Guhlich-Bornhof, U., Koehler, A.B., St�ber, M., Mollenkopf, H.J., Hurwitz, R., Furkert, J., Krause, G., Weiner, J., Jacinto, A., Mihai, I., Leite-de-Moraes, M., Siebenhaar, F., Maurer, M., Kaufmann, S.H.E.
- Source
- Full text @ Sci. Rep.

Lawsone stimulation modulates keratinocyte proliferation and differentiation. (A) Nuc red Live 647 positive HEK cells at different time points after stimulation with Lawsone (Law, 10 µM) and Phthiocol (Pht, 50 µM), compared to DMSO. (B) Epidermal differentiation complex and keratin gene enrichment of HEK cells after Lawsone stimulation (10 μM) and relative to TLR2 stimulation (Pam2CSK4, 0.236 μM) at (left) 4 h and (right) 24 h. Area under the curve (AUC), q-value and highly enriched genes are indicated. (C) KRT2, CNFN, HRNR, LCE3D and FLG2 expression of HEK cells after 24 h stimulation with Lawsone (10 µM) normalized to DMSO. Each color depicts results of the same individual. (D) LCE3D, KRT2, HRNRand CNFN expression on HEK cells transfected with AhR-siRNA (siAhR) or Scramble control (siScr) and further stimulated for 24 h with Lawsone (10 μM). Values are relative to siScr. Each color depicts results of the same individual. (E, top) Epidermal skin equivalents were stimulated for 5d with Lawsone (10 µM) or DMSO and stained with DAPI (blue) and the proliferation marker KI67 (purple). (E, bottom) Percentage of KI67 positive cells normalized to the total number of cells (DAPI). (F) Representative of an in vitro epidermis model experiment stained for Cornifelin (red) and Loricrin (green) and (G) protein expression of Filaggrin, Cornifelin and Loricrin at day 5 or 10 of culture after stimulation with 10 or 100 µM of Lawsone (blots were cropped from the same gel. Full unedited gels are provided in Supplementary Data). (A,C) Data from 3 independent experiments are shown. (D) Data from 2 independent donors. (E top, F,G) One representative experiment out of 2 is shown. (E) Pooled data from 2 different experiments is shown. (A) Mean + S.E.M., (C–E bottom) Floating bars, Mean Min to Max. (A) Two-way ANOVA with Fisher’s test, (C) One-way ANOVA with Dunn’s test. (E, bottom) Student’s t-test. *P < 0.05; **P < 0.01, ***P < 0.001, ****P < 0.0001. |

Henna and Lawsone activate AhR in zebrafish larvae. (A,B) Fold induction of CYP1A, AhRRa and AhRRb transcripts from zebrafish larvae (2 days post-fertilization, dpf) treated (red squares) or not (black circles) for 2 h with 5 µM of AhR inhibitor CH223191, followed by further 4 h stimulation with (A) Henna (equivalent to 10 μM Lawsone), (B) Lawsone (10 μM) or DMSO vehicle control. Triplicates of 12 larvae depicted in each data point. (C) Scheme of the semi-high throughput experimental design developed to measure zebrafish larvae CYP1A enzymatic activity. (D) Representative images obtained upon CYP1A activity measurements using an Array Scan TM XTI Live High Content Platform. (E) CYP1A enzymatic activity expressed as total intensity of resorufin detected per larva (each dot represents one larva). 1 representative experiment out of 3 are shown (n = 36 larvae per condition). (A,B) Data from 1 representative experiment out of 3 is shown. (A,B) Floating bars, Mean Min to Max. (A,B) Two-way ANOVA with Bonferroni’s test. (E) Two-way ANOVA with Fisher’s test. **P < 0.01, ***P < 0.001; ****P < 0.0001. |
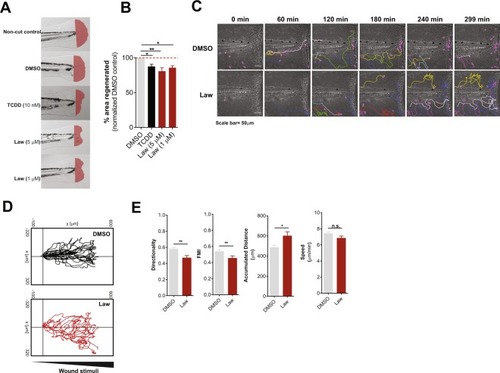
Lawsone inhibits wound healing and skin regeneration in vivo. (A) Representative images of zebrafish fin regeneration 3 days post amputation (dpa) and exposure to different stimuli. Regenerated area depicted in red. (B) Quantification of the zebrafish tail fin area regenerated, normalized to DMSO treated larvae. (C) Neutrophil migration to zebrafish tailfin wounds visualized in DMSO or Lawsone-treated transgenic larvae Tg(mpeg.mCherryCAAX SH378 mpx:GFP i114). Frames from representative movies of migrating leukocytes in the wounded tail fin are shown. The lines indicate tracking of individual neutrophils over the indicated time point of the experiment. Wound is represented with a white dashed line. (D) 2D tracks of individual neutrophils migrating in the tail fin of wounded neutrophil-GFP zebrafish 3dpf larvae exposed to 10 µM Lawsone (n = 8) or DMSO (n = 23). (E) Quantification of 2D directionality, Forward migration index (FMI), accumulated distance and speed of individual leukocytes in the wounded tailfin. (B) Pooled data from 4 independent experiments with at least 24 larvae per condition per experiment, Mean + S.E.M., (E) Data from 2 pooled experiments, Mean + S.E.M. (B) One-way ANOVA with Fisher’s test, (E) Student’s t-test. *P < 0.05; **P < 0.01; ***P < 0.001; n.s.-not significant. |
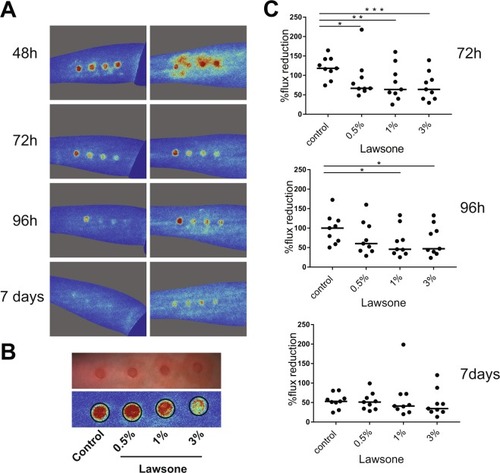
Lawsone ameliorates skin recovery in a model of human contact skin irritation. (A) Representative images of blood flux measured using the MoorFLPI-2 Full_Field Laser Perfusion Imager V1.1 software at 48-72-96 h and 7 days upon application of 0.5% SDS. Cream containing increasing concentration of Lawsone (% of Lawsone = weight of Lawsone (g) per 100 g of cream) was applied 24 h after SDS treatment. (B) Example of (top) irritation spots and (bottom) blood flux quantification. After SDS applicationall individuals were treated as follow: far left: control cream, left: 0.5%; right 1%; far right 3% Lawsone cream. (C) Percentage of flux reduction at different time points normalized to the respective average flux intensity measured at 48 h post-SDS application. (A) Representative responses of 2 out of 9 volunteers are shown. (C) Data from 9 individuals are shown. One-way ANOVA with Fisher’s test. *P < 0.05; **P < 0.01; ***P < 0.001. |
Acknowledgments
This image is the copyrighted work of the attributed author or publisher, and
ZFIN has permission only to display this image to its users.
Additional permissions should be obtained from the applicable author or publisher of the image.
Full text @ Sci. Rep.