
- Title
-
A zebrafish drug screening platform boosts the discovery of novel therapeutics for spinal cord injury in mammals
- Authors
- Chapela, D., Sousa, S., Martins, I., Cristóvão, A.M., Pinto, P., Corte-Real, S., Saúde, L.
- Source
- Full text @ Sci. Rep.
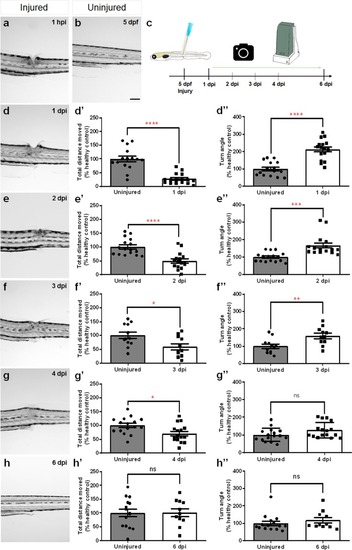
Temporal profile of tissue regeneration and locomotor recovery upon spinal cord transection in 5 dpf zebrafish larvae. (b) Brightfield image of the trunk/tail area of an injured 5 dpf larva. (c) Experimental design for the analysis of the temporal profile of tissue regeneration and locomotor recovery. (a,d–h) Brightfield images of the recovery of zebrafish larvae with a lesion in the dorsal trunk area from 1 hpi to 6 dpi. (d’–h’) Total distance moved and (d”–h”) turn angle parameters of injured larvae and age-matched uninjured controls at 1 dpi (n = 16 uninjured larvae, n = 16 injured larvae), 2 dpi (n = 16 uninjured larvae, n = 16 injured larvae), 3 dpi (n = 12 uninjured larvae, n = 11 injured larvae), 4 dpi (n = 16 uninjured larvae, n = 16 injured larvae) and 6 dpi (n = 15 uninjured larvae, n = 11 injured larvae). dpf_days-post-fertilization, hpi_hours-post-injury. Mean ± s.e.m. of one experiment is presented. ns - not significant, *p < 0.05, **p < 0.01, ***p < 0.001 and ****p < 0.0001, Student’s t-test with Welch’s correction. Scale bar: 200 µm. |
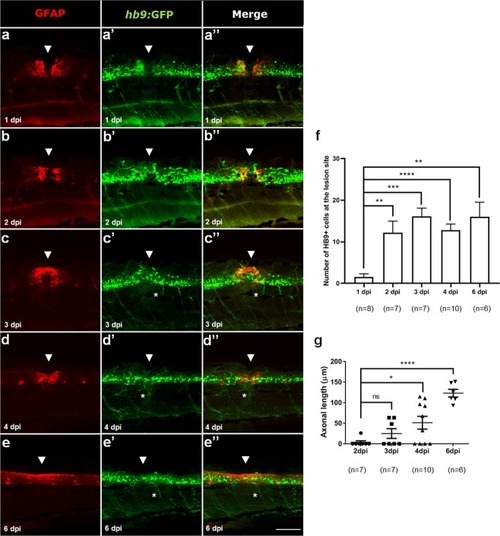
Glial bridge formation and motor neurons regeneration after SCI in 5 dpf larvae. Labeling pattern of Hb9:GFP transgenic larvae with double immunohistochemistry against GFAP (red) to reveal the glial bridge (a–e) and against GFP (green) to reveal HB9+ motor neurons (a’–e’) from 1 to 6 dpi. (a”–e”) Merged channels for each time point. White arrowheads show the lesion site and asterisks highlight the regenerating HB9+ peripheral axons. Rostral side is to the left and dorsal side is up. Number of HB9+ motor neurons (f) and length of HB9+ peripheral axons (g) at the lesion site from 1 to 6 dpi. SCI_spinal cord injury, dpf_days-post-fertilization, hpi_hours-post-injury Mean ± s.e.m. of one experiment is presented. ns - not significant, *p < 0.05, **p < 0.01, ***p < 0.001 and ****p < 0.0001, Student’s t-test with Welch’s correction. Scale bar: 100 µm. |