
Fig. 1
- ID
- ZDB-FIG-190820-61
- Publication
- Chapela et al., 2019 - A zebrafish drug screening platform boosts the discovery of novel therapeutics for spinal cord injury in mammals
- Other Figures
- All Figure Page
- Back to All Figure Page
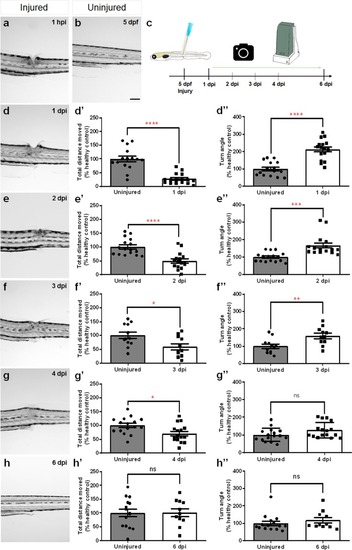
Temporal profile of tissue regeneration and locomotor recovery upon spinal cord transection in 5 dpf zebrafish larvae. (b) Brightfield image of the trunk/tail area of an injured 5 dpf larva. (c) Experimental design for the analysis of the temporal profile of tissue regeneration and locomotor recovery. (a,d–h) Brightfield images of the recovery of zebrafish larvae with a lesion in the dorsal trunk area from 1 hpi to 6 dpi. (d’–h’) Total distance moved and (d”–h”) turn angle parameters of injured larvae and age-matched uninjured controls at 1 dpi (n = 16 uninjured larvae, n = 16 injured larvae), 2 dpi (n = 16 uninjured larvae, n = 16 injured larvae), 3 dpi (n = 12 uninjured larvae, n = 11 injured larvae), 4 dpi (n = 16 uninjured larvae, n = 16 injured larvae) and 6 dpi (n = 15 uninjured larvae, n = 11 injured larvae). dpf_days-post-fertilization, hpi_hours-post-injury. Mean ± s.e.m. of one experiment is presented. ns - not significant, *p < 0.05, **p < 0.01, ***p < 0.001 and ****p < 0.0001, Student’s t-test with Welch’s correction. Scale bar: 200 µm. |