- Title
-
Pioneer and repressive functions of p63 during zebrafish embryonic ectoderm specification
- Authors
- Santos-Pereira, J.M., Gallardo-Fuentes, L., Neto, A., Acemel, R.D., Tena, J.J.
- Source
- Full text @ Nat. Commun.
|
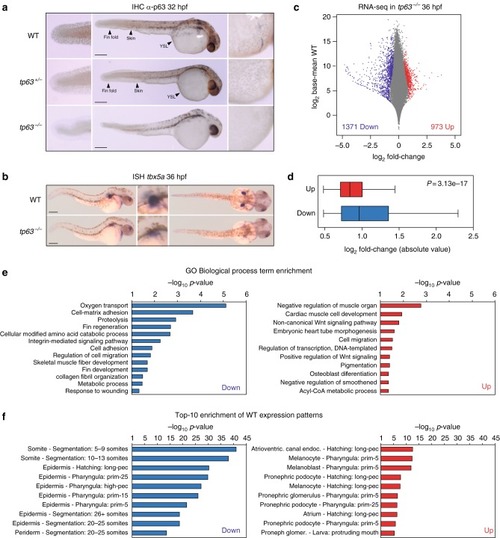
Zebrafish tp63−/− mutant embryos show de-regulated epidermal program. a Whole-mount embryo immunostaining of p63 in wild-type (WT), heterozygous tp63+/− and homozygous tp63−/− embryos at 32 h post fertilization (hpf) showing the absence of p63 expression in tp63−/− mutants. Left, zoomed lateral view of the tail; middle, lateral view of whole-embryo; right, zoomed lateral view of the yolk. YSL, yolk syncytial layer. b Whole-mount in situ hybridization of the tbx5a gene in WT and tp63−/−embryos at 36 hpf showing expression in eye, heart and pectoral fin bud, the latter one being reduced in tp63−/− mutant accordingly with the absence of this anatomical structure. Left, lateral view of whole embryo; middle, zoomed lateral view of the pectoral fin bud; right, dorsal view of whole embryo. For a and b, anterior is to the right. For a and b, scale bars represent 250 µm. c Differential analysis of gene expression between WT and tp63−/− at 36 hpf from RNA-seq (n = 3 biological replicates per condition). The log2 base mean WT transcript expression levels versus the log2 fold-change of expression are plotted. Transcripts showing a statistically significant differential expression (p < 0.05) are highlighted in red (upregulated) or blue (downregulated). d Box plot representing the absolute log2 fold-change of the up- (n = 973) and down-regulated (n = 1,371) transcripts from (c). Center line, median; box limits, upper and lower quartiles; whiskers, 1.5× interquartile range. p value according to the Wilcoxon’s rank sum test is shown. Source data are provided as a Source Data file. e Gene Ontology (GO) Biological Process term enrichment of the genes corresponding to the up- and down-regulated transcripts from (c). f Top-10 enrichment of WT expression patterns of the genes corresponding to the up- and down-regulated transcripts from (c). For e and f, the -log10 of p-value for each term is shown
|
|
p63 and Sox3 binding to chromatin and co-expression at the neural plate border. aVenn diagram showing the overlap between p63 and Sox3 peaks from ChIPmentation in 80% of epiboly, 24 hpf and 36 hpf embryos (n = 2 biological replicates per stage). b Top-10 enrichment of WT expression patterns of the genes associated to the common peaks from (a). The -log10 p-value for each term is shown. c Motif enrichment analysis of the common peaks from (a). Top-5 motifs are represented with their motif logos, TF name, percentage of peaks containing the motif and enrichment p-value. d Distribution of distances from the p63 ChIP-seq summits to either the p63 or Sox3 motifs in total p63 peaks containing the p63 motif (n = 7,904) or in common peaks containing the Sox3 motif (n = 4,286), respectively, within a 400-bp window centered in the motifs. e Footprint analysis of p63 and Sox3 binding to their motifs. Average read counts of Tn5 cutting sites for p63 or Sox3 ChIPmentation signal are plotted centered in either the p63 or Sox3 motifs within a 100-bp window. For p63 signal over p63 motif, total p63 BSs containing the p63 motif (n = 7,904) were used. For Sox3 signal over Sox3 motif, total Sox3 BSs containing the Sox3 motif (n = 20,817) were used. For p63 signal over Sox3 motif and viceversa, common BSs containing the Sox3 (n = 4,286) or the p63 motif (n = 1,645), respectively, were used. fBranchpoint plots of the ectoderm development from scRNA-seq data in zebrafish early development46 showing pseudotime (x-axis) and random walk visitation preference from the neural to the epidermal domains (y-axis). Top, cells colored by developmental stage. Middle and bottom, gene expression of sox3 and tp63 in red and green, respectively. An ellipse marks the intermediate region between both domains. Arrowheads point to individual cells co-expressing both genes in this intermediate region. g Double whole-mount embryo immunofluorescence of Sox3 (magenta) and p63 (green) in the neural plate border of bud embryos. Arrowheads point to representative nuclei showing co-expression of both markers. NE neuroectoderm, SE surface ectoderm. Scale bars represent 100 µm. See also Supplementary Fig. 2
EXPRESSION / LABELING:
|


