
- Title
-
Hexb enzyme deficiency leads to lysosomal abnormalities in radial glia and microglia in zebrafish brain development
- Authors
- Kuil, L.E., López Martí, A., Carreras Mascaro, A., van den Bosch, J.C., van den Berg, P., van der Linde, H.C., Schoonderwoerd, K., Ruijter, G.J.G., van Ham, T.J.
- Source
- Full text @ Glia
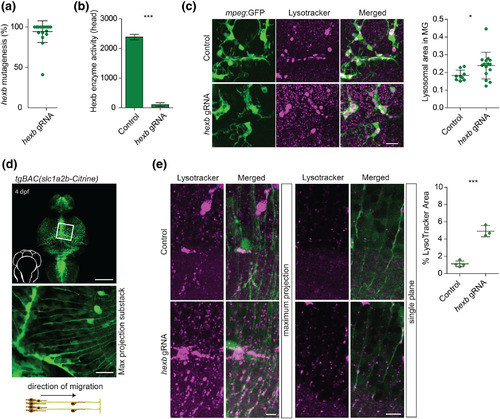
Efficient mutagenesis in hexb crispants shows abnormal lysosomes in microglia and radial glia. (a) graph shows mutagenesis efficiency for 24 injected fish at 4 dpf. Each dot represents 1 larva. (b) hexb crispants show almost no enzymatic conversion of substrate by β‐Hexosaminidase A + B at 4dpf. (c) Representative images of microglia in 8 dpf larvae imaged in the depicted area. Scale bar represents 20 μm. Quantification of lysotracker (LT+) area within microglia relative to the total microglial area in 8 dpf larvae. Each dot represents 1 larva. (d) Expression pattern of the tgBAC(slc1a2b:Citrine) transgenic line at 4 dpf, with magnification/sub‐stack showing the radial fibers in the optic tectum, and a schematic showing radial glia orientation and direction of neurogenic migration along the radial fibers. Scale bars represent 100 and 20 μm, respectively. (e) Representative images of radial glia at 4 dpf in controls and in hexb crispants with quantification of relative LT+ signal per measured total area. Each dot represents 1 larva. Scale bars represent 10 μm. |
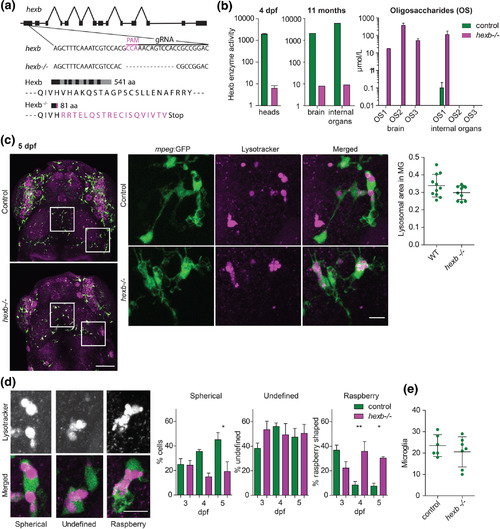
Stable hexb−/− fish show impaired Hexb enzyme function and lysosomal abnormalities in microglia. (a) Schematic representation of the hexb gene and the 18 bp gRNA and PAM motif. The hexb−/− fish show a 14 bp out of frame deletion disrupting part of the gRNA target sequence and PAM motif, resulting in 19 out of frame amino acids (magenta) followed by a premature stop codon. (b) Enzymatic substrate conversion by β‐Hexosaminidase A + B in larval heads and adult brain and internal organs—containing: intestine, liver, spleen, pancreas and gonads. Mass spectrometry analysis of Hexb deficiency associated oligosaccharide (OS) marker abundance based on exact mass (Hex2‐HexNAc2, 747.267 (OS1); Hex3‐HexNAc3, 1,112.399 (OS2); Hex3‐HexNAc4, 1,315.479 (OS3)) in 1.5 year old hexb−/− and control brains and internal organs—containing: intestine, liver, spleen, pancreas and gonads. (c) Representative images of microglia in LT‐stained larvae at 5 dpf, scale bar represents 100 μm. Quantifications were performed on detailed images of depicted regions, scale bar represents 10 μm. Quantification of relative lysotracker area within microglia. (d) Classification of lysosomal morphology in microglia with their quantification at 3, 4, and 5 dpf. n = 4 to 6 larvae per group. Scale bars represent 10 μm. (e) Quantification of total microglia in the imaged regions. PHENOTYPE:
|
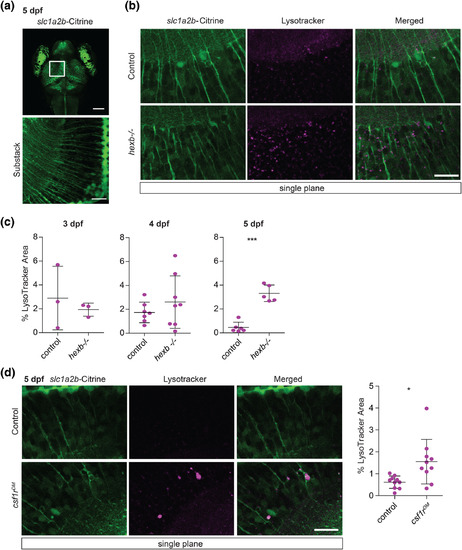
Hexb−/− larvae show increased number of lysosomal speckles in radial glia. (a) Representative image of tgBAC(slc1a2b:Citrine) expression in 5 dpf larval brain with magnifications of radial protrusions in the optic tectum. Scale bars represent 100 μm and 20 μm respectively. (b) Representative images of radial glia in LT stained larvae at 5 dpf in areas quantified in (c). Scale bar represents 20 μm. The brightness of the control LT image was enhanced to indicate the presence of some LT+ speckles. (c) Quantification of LT coverage, in percentage, within quantified areas. Each dot represents one larva. Error bars represent SD. (d) Representative images of control and csf1rDM larvae at 5 dpf, stained with LT and quantification. PHENOTYPE:
|
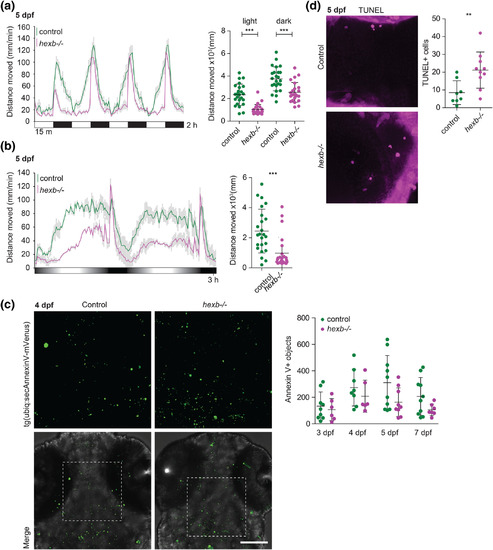
Locomotor activity assay shows abnormal locomotor activity in hexb−/− larvae. (a) Representative graph showing the locomotor responses of larvae to alternating light and dark periods indicated by white and black squares in one single experiment. The dot plot shows the quantification of the sum distance moved during all the light and all the dark periods. (b) Representative graph showing the total distance travelled by larvae during the dusk‐dawn routine (total time: 3 hr 12 min). Quantification of the total distance moved throughout the experiment excluding the dark period. (a, b) n = 24 larvae per genotype. Grey shading shows the standard error of the mean. (c) Representative images of control and hexb−/−larvae at 4 dpf transiently expressing secreted annexin V tagged with mVenus. Quantification of annexin V positive objects at 3, 4, 5, and 7 dpf. Scale bar represents 100 μm. (d) Representative images of TUNEL staining at 5 dpf with quantifications. Each dot represents one larva. PHENOTYPE:
|