
Fig. 1
- ID
- ZDB-IMAGE-191011-3
- Publication
- Kuil et al., 2019 - Hexb enzyme deficiency leads to lysosomal abnormalities in radial glia and microglia in zebrafish brain development
- All Figures
- Figures for Kuil et al., 2019
|
Fig. 1
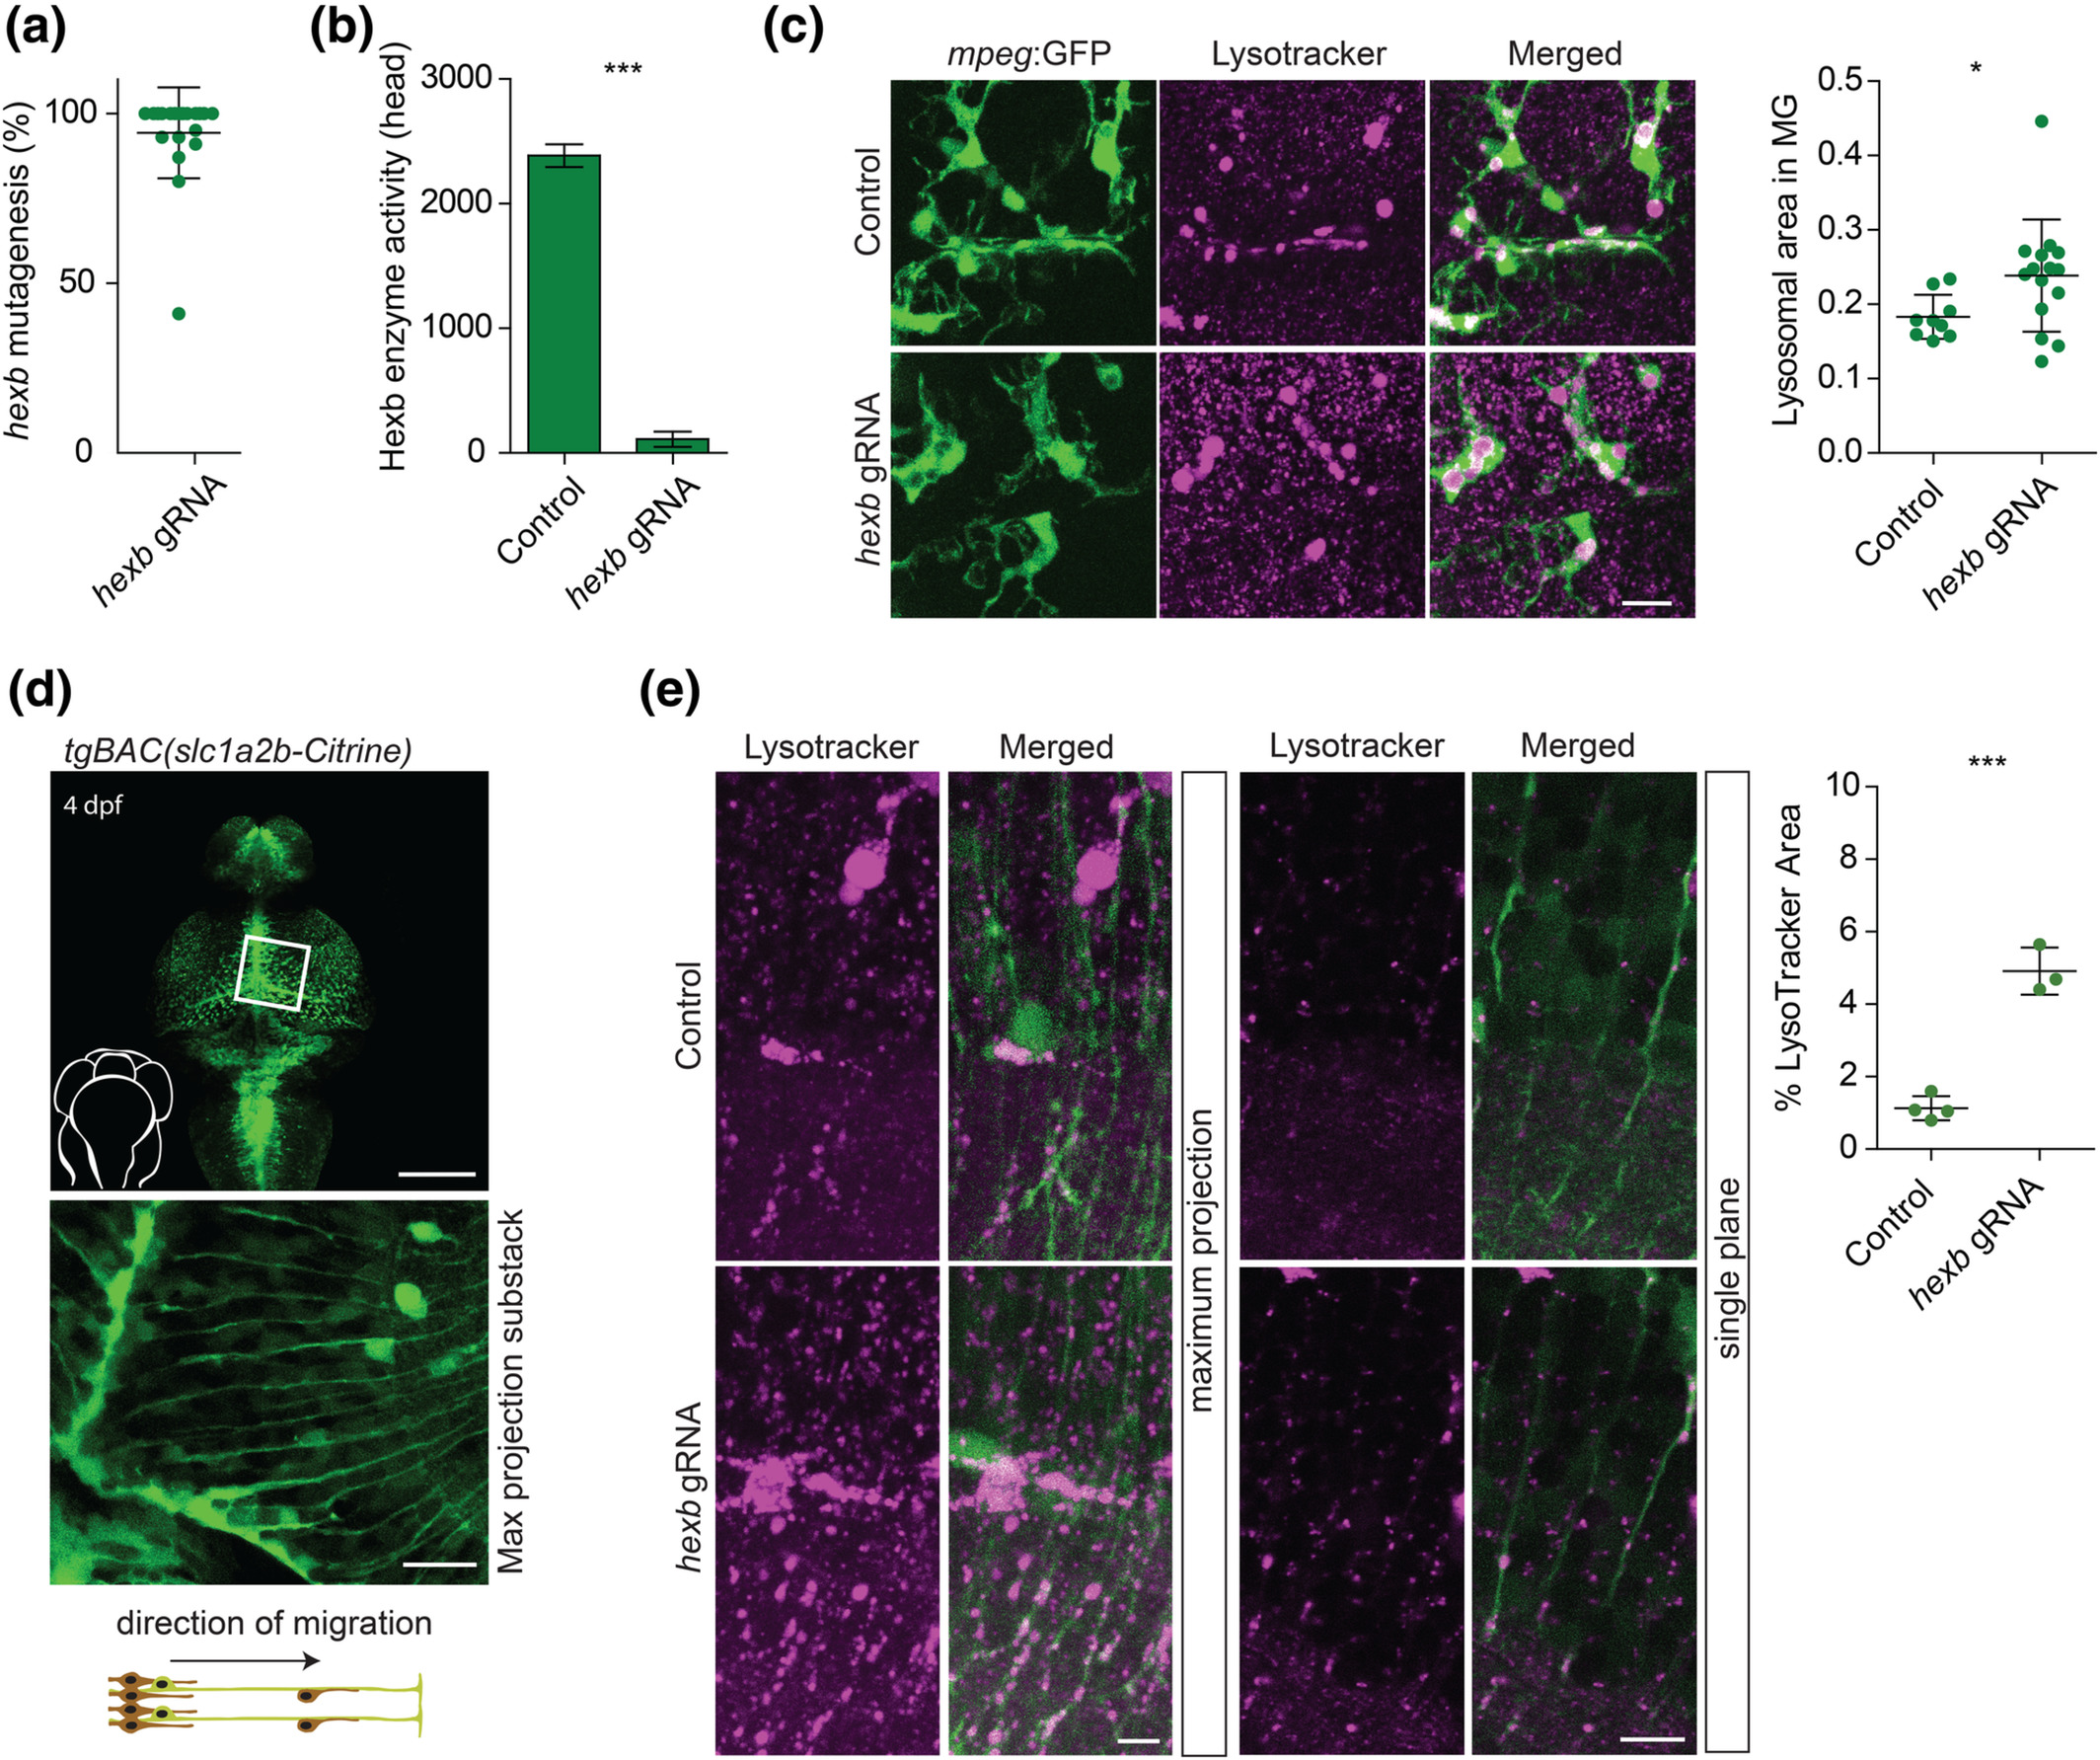
Efficient mutagenesis in hexb crispants shows abnormal lysosomes in microglia and radial glia. (a) graph shows mutagenesis efficiency for 24 injected fish at 4 dpf. Each dot represents 1 larva. (b) hexb crispants show almost no enzymatic conversion of substrate by β‐Hexosaminidase A + B at 4dpf. (c) Representative images of microglia in 8 dpf larvae imaged in the depicted area. Scale bar represents 20 μm. Quantification of lysotracker (LT+) area within microglia relative to the total microglial area in 8 dpf larvae. Each dot represents 1 larva. (d) Expression pattern of the tgBAC(slc1a2b:Citrine) transgenic line at 4 dpf, with magnification/sub‐stack showing the radial fibers in the optic tectum, and a schematic showing radial glia orientation and direction of neurogenic migration along the radial fibers. Scale bars represent 100 and 20 μm, respectively. (e) Representative images of radial glia at 4 dpf in controls and in hexb crispants with quantification of relative LT+ signal per measured total area. Each dot represents 1 larva. Scale bars represent 10 μm.