
Fig. 4
- ID
- ZDB-IMAGE-191011-6
- Publication
- Kuil et al., 2019 - Hexb enzyme deficiency leads to lysosomal abnormalities in radial glia and microglia in zebrafish brain development
- All Figures
- Figures for Kuil et al., 2019
|
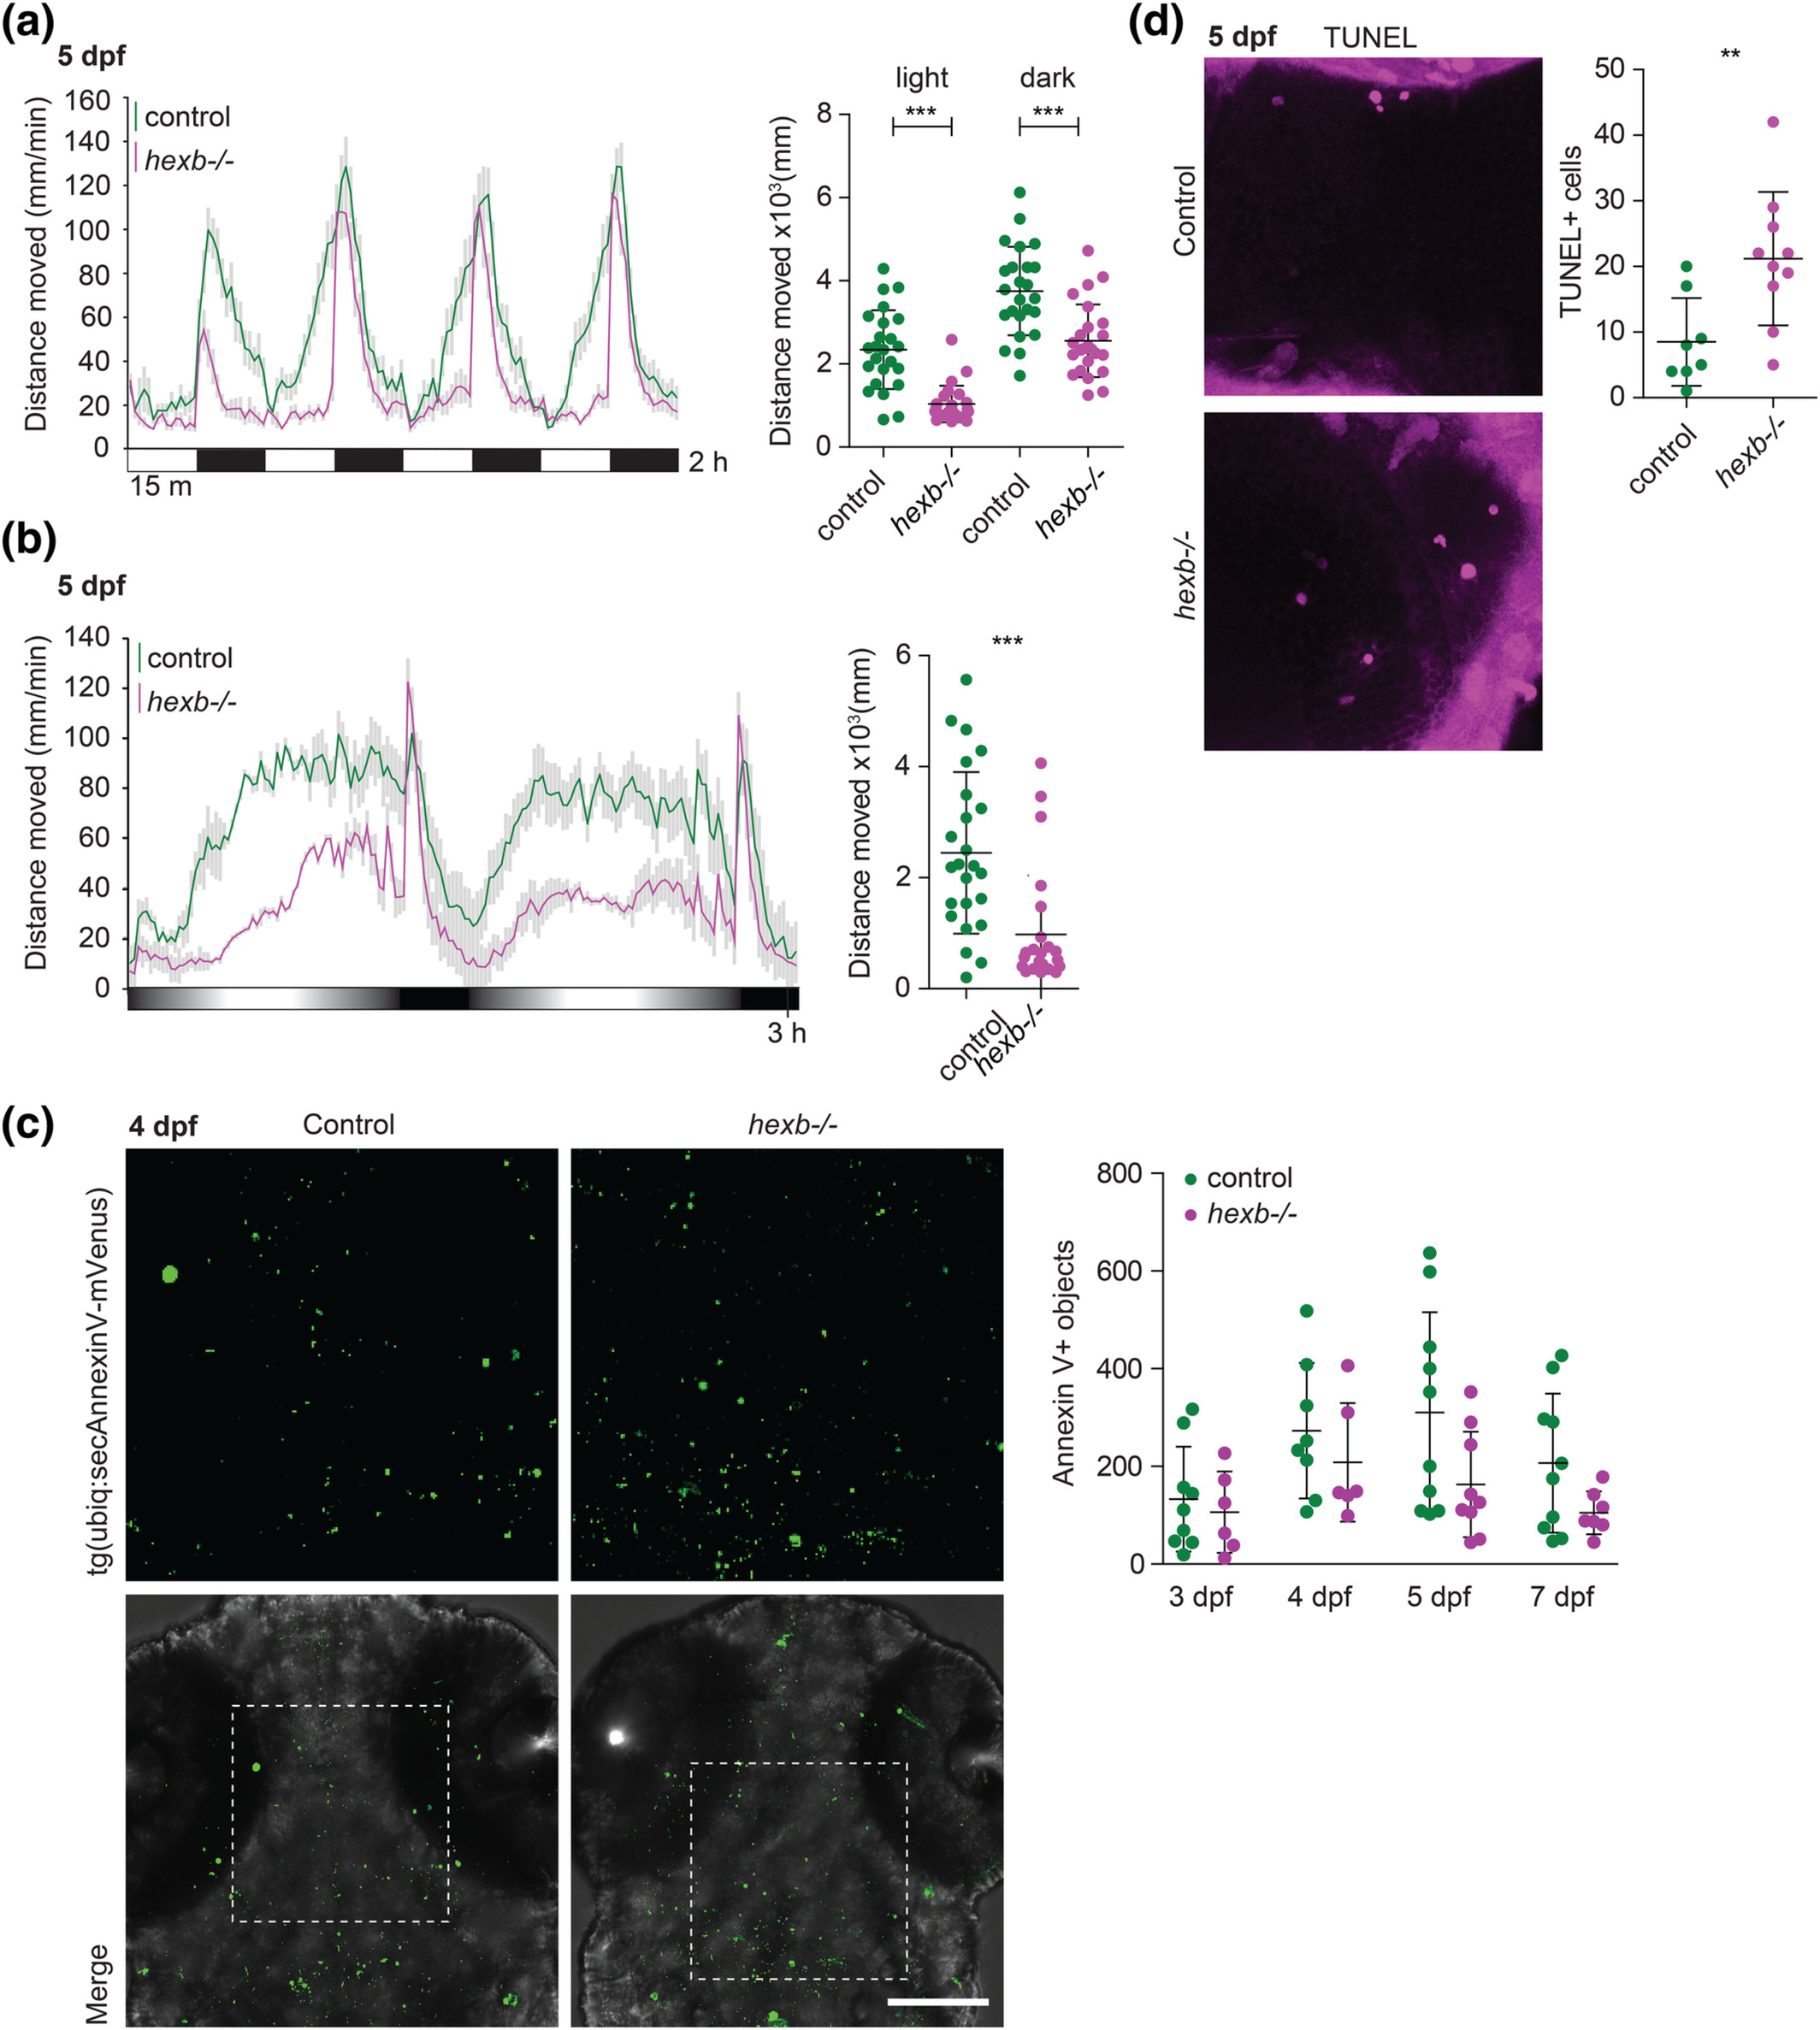
Fig. 4
Locomotor activity assay shows abnormal locomotor activity in hexb−/− larvae. (a) Representative graph showing the locomotor responses of larvae to alternating light and dark periods indicated by white and black squares in one single experiment. The dot plot shows the quantification of the sum distance moved during all the light and all the dark periods. (b) Representative graph showing the total distance travelled by larvae during the dusk‐dawn routine (total time: 3 hr 12 min). Quantification of the total distance moved throughout the experiment excluding the dark period. (a, b) n = 24 larvae per genotype. Grey shading shows the standard error of the mean. (c) Representative images of control and hexb−/−larvae at 4 dpf transiently expressing secreted annexin V tagged with mVenus. Quantification of annexin V positive objects at 3, 4, 5, and 7 dpf. Scale bar represents 100 μm. (d) Representative images of TUNEL staining at 5 dpf with quantifications. Each dot represents one larva.