
Fig. 3
- ID
- ZDB-IMAGE-191011-5
- Publication
- Kuil et al., 2019 - Hexb enzyme deficiency leads to lysosomal abnormalities in radial glia and microglia in zebrafish brain development
- All Figures
- Figures for Kuil et al., 2019
|
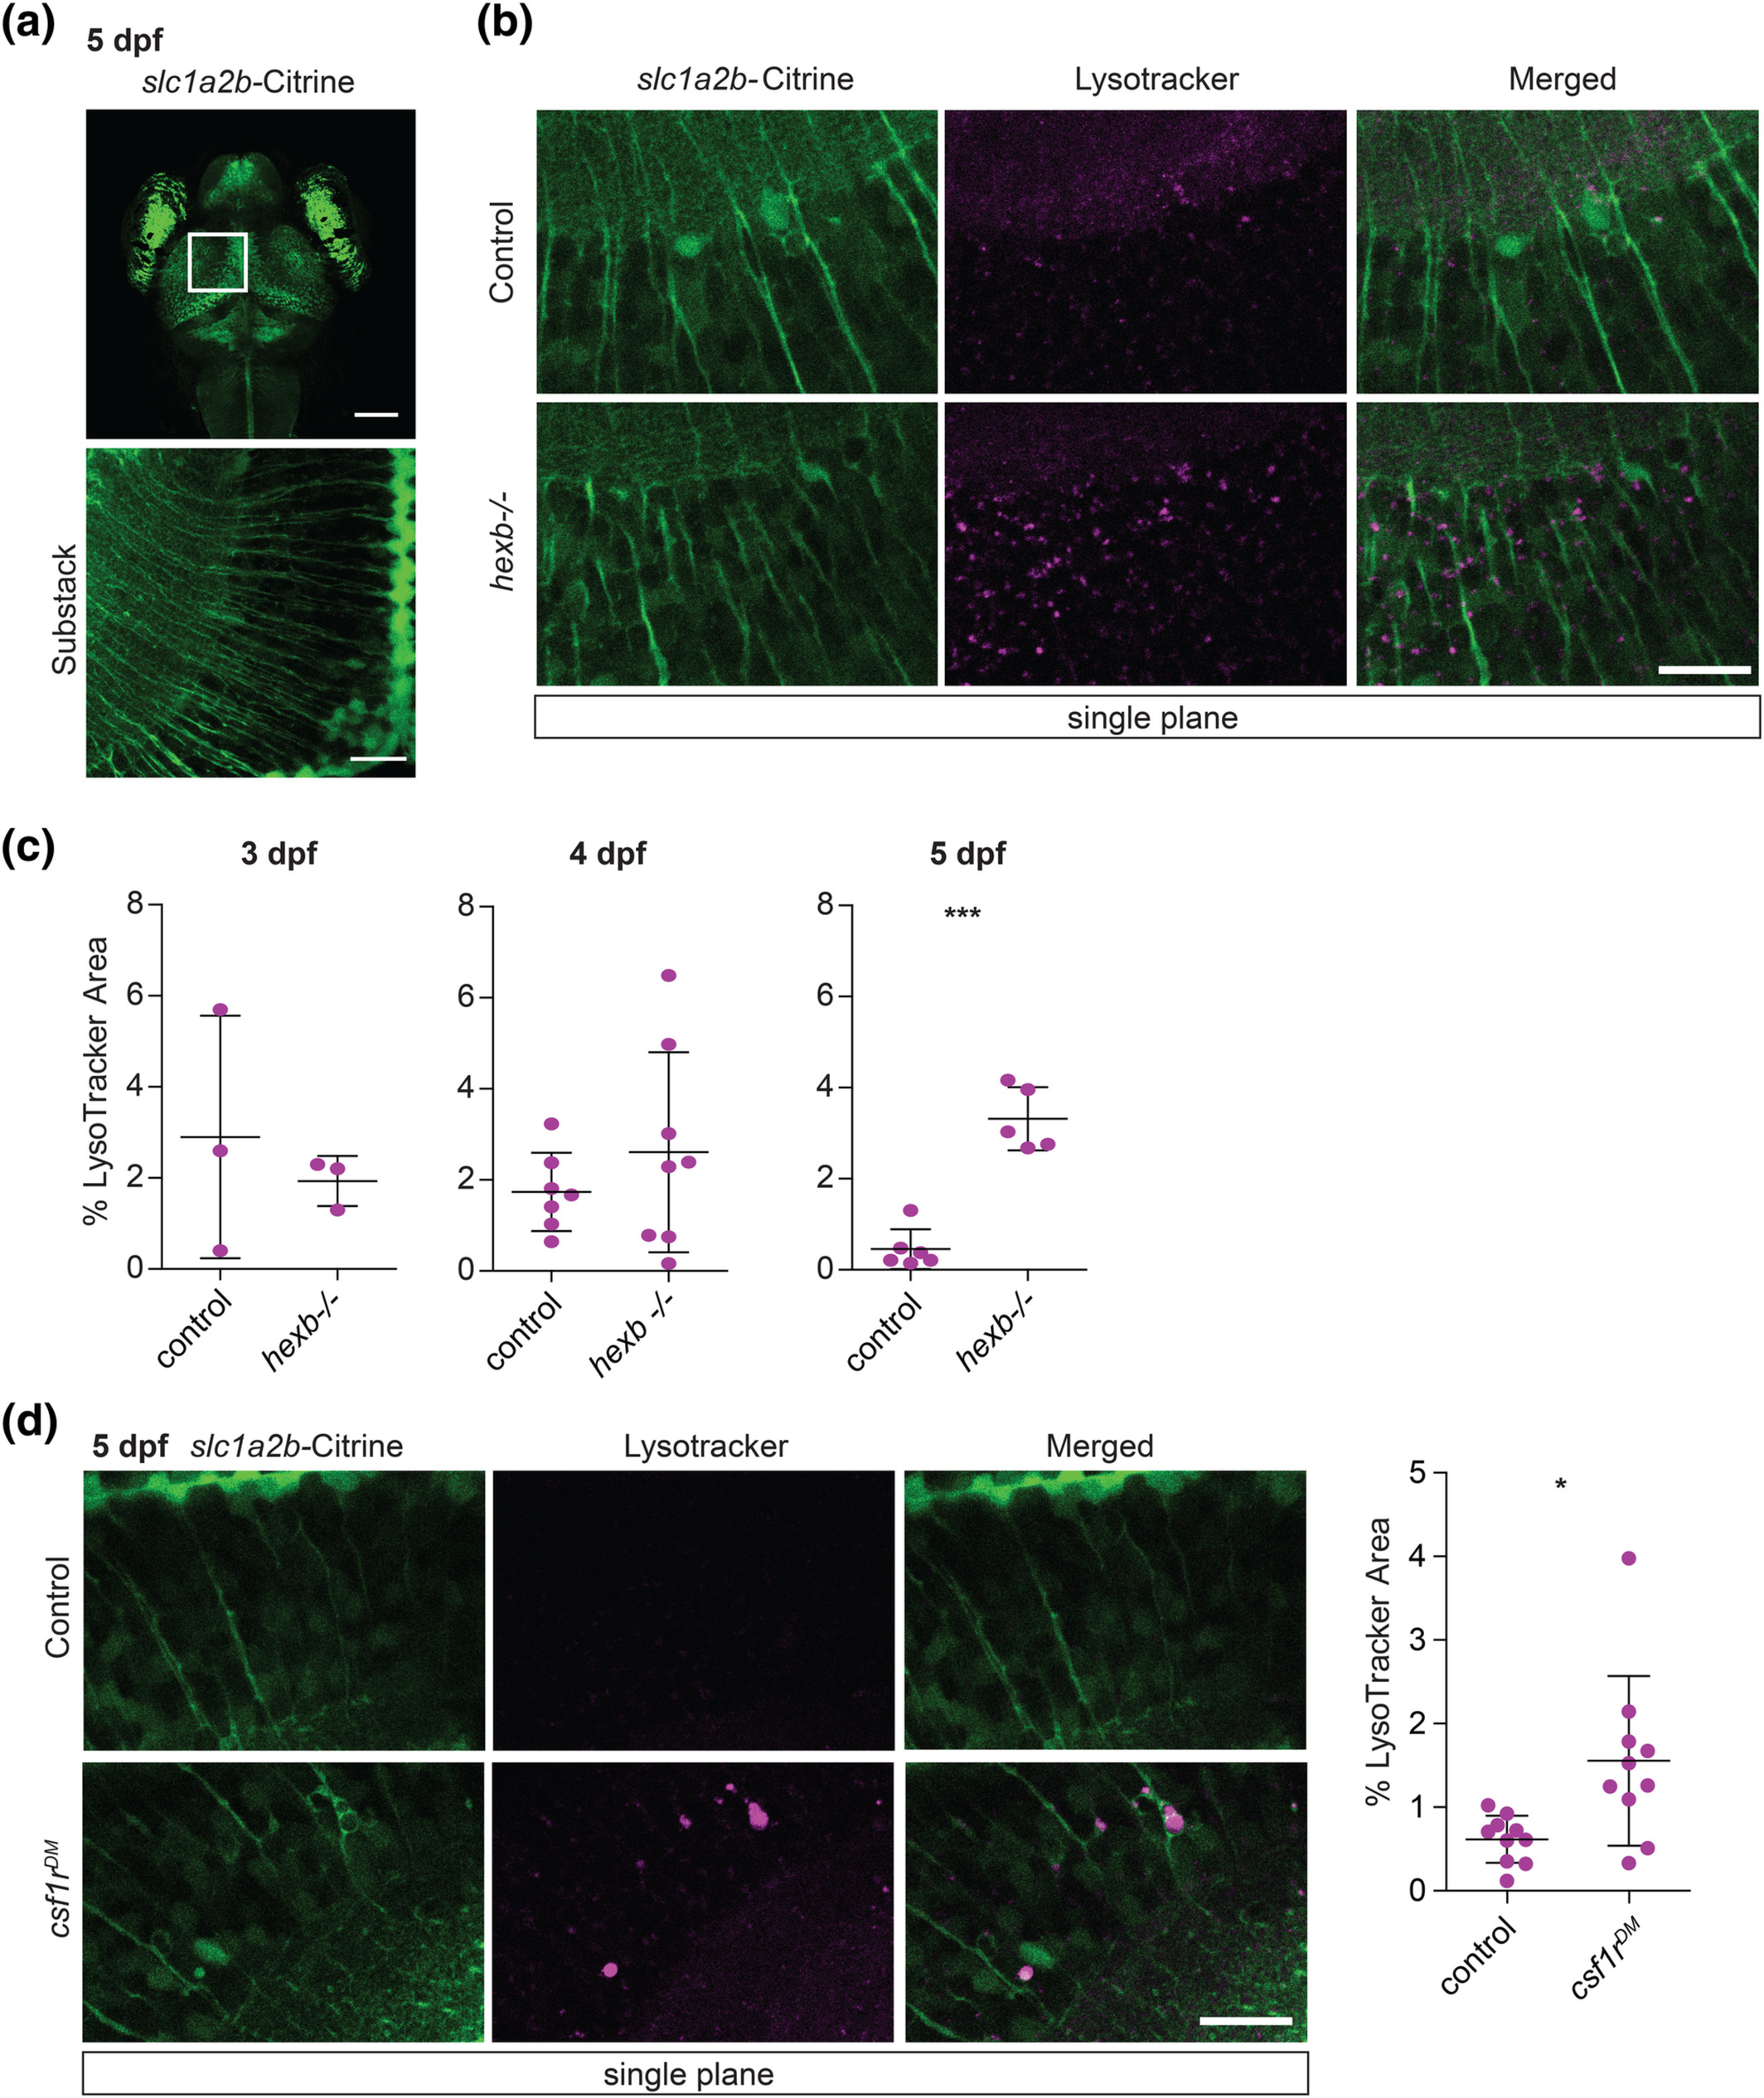
Fig. 3
Hexb−/− larvae show increased number of lysosomal speckles in radial glia. (a) Representative image of tgBAC(slc1a2b:Citrine) expression in 5 dpf larval brain with magnifications of radial protrusions in the optic tectum. Scale bars represent 100 μm and 20 μm respectively. (b) Representative images of radial glia in LT stained larvae at 5 dpf in areas quantified in (c). Scale bar represents 20 μm. The brightness of the control LT image was enhanced to indicate the presence of some LT+ speckles. (c) Quantification of LT coverage, in percentage, within quantified areas. Each dot represents one larva. Error bars represent SD. (d) Representative images of control and csf1rDM larvae at 5 dpf, stained with LT and quantification.