FIGURE SUMMARY
Title

Mutation in the mouse histone gene Hist2h3c1 leads to degeneration of the lens vesicle and severe microphthalmia

Authors
Vetrivel, S., Tiso, N., Kügler, A., Irmler, M., Horsch, M., Beckers, J., Hladik, D., Giesert, F., Gailus-Durner, V., Fuchs, H., Sabrautzki, S., German Mouse Clinic, Helmholtz Zentrum München, German Research Center for Environmental Health GmbH, Neuherberg, Germany, Adler, T., Treise, I., Busch, D.H., Aguilar-Pimentel, A., Ollert, M., Götz, A., Amarie, O.V., Stoeger, T., Schulz, H., Becker, L., Klopstock, T., Schrewe, A., Spielmann, N., Bekeredjian, R., Garrett, L., Hölter, S.M., Zimprich, A., Wurst, W., Mayer-Kuckuk, P., Hans, W., Rozman, J., Klingenspor, M., Neff, F., da Silva-Buttkus, P., Calzada-Wack, J., Rácz, I., Zimmer, A., Rathkolb, B., Wolf, E., Prehn, C., Adamski, J., Östereicher, M., Miller, G., Steinkamp, R., Lengger, C., Maier, H., Stoeger, C., Leuchtenberger, S., Gailus-Durner, V., Fuchs, H., Hrabě de Angelis, M., Hrabě de Angelis, M., Graw, J.
Source
Full text @ Exp. Eye. Res.
Histological analysis of the microphthalmia phenotype. The comparative histological staining between the wild-type and homozygous Aey69 eyes are shown. Eye development is demonstrated from embryonic day E10.5 until postnatal day (P) 7. The figure summarizes the major disruptions in development starting from the lens vesicle stage of E11.5 (a–d) and the overgrowing of the retina into the empty lens space after birth (e–h). In particular, at E11.5 in the wild type there is no surface ectoderm connection between the future cornea and lens. However, in the mutant the surface ectoderm connection is maintained (as highlighted by black arrows) through the embryonic stages of E11.5-E13.5, when the lens gradually disappears. Further changes in later embryonic stages are also highlighted by their respective black arrows: at E15.5 increased infiltration of periocular mesenchymal cells into the mutant vitreal space, at E17.5 altered bending of retinal layers anterior to the cornea, and at P1 the mutant retinal layers are observed to be much thicker compared to the wild type. The bars indicate 100 μm at E10.5-E12.5, 50 μm at E13.5 - E15.5, and 0.1 mm at P7. L, lens; R, retina; ON, optic nerve; INBL, inner neuroblastic layer; ONBL, outer neuroblastic layer.

Linkage and sequence analysis of Aey69 mutation. a) Haplotype analysis defines the critical interval between the markers D3Mit188 and D3Mit11 at mouse chromosome 3. The analysis was performed in two steps separated by the black line; the markers D3Mit188 and D3Mit76 were used only in the 9 mice with a recombination between D3Mit141 and D3Mit11. The numbers of mice for each haplotype are given; 7 mice of the F2 panel had the B6 allele of all markers tested, but carried the Aey69 mutation. Black squares are heterozygotes, and empty squares represent homozygotes for the C57Bl/6 J allele. The red arrows mark the critical interval for the underlying mutation; the genetic distances (given in cM) and the exact physical positions of the markers (given in Mb) are from the MGI database (http://www.informatics.jax.org/; Dec. 2018). b) Sanger sequencing confirmed the exome sequencing data (c. 358 A-> C; red circles). c) The change in the amino acid sequence (Ile120Leu) is given below and boxed in yellow with a red surrounding line; the underlined DNA sequence (CCTC) demonstrates the new MnlI restriction site in the mutants. Schematic drawing of the mouse Hist2h3c1 gene (ENSEMBL) is given below the nucleotide sequence; the red arrow points to the site of the mutation at the C-terminal end of this single-exon gene. d) The novel MnlI restriction site is present in all homozygous mutant mice tested. It is absent in 5 tested wild-type strains indicating that it is a mutation and no widespread polymorphism. The schema above the gels explains the digestion pattern of the fragment, and the size of the critical bands is given in red or green. The red arrows point to these critical bands and their sizes are indicated; +, with MnlI restriction enzyme; -, without restriction enzyme.

QPCR analysis of Histone H3.2 coding genes. a) Relative expression levels of histone genes in the wild-type tissues of brain, liver, lens and retina. Rplp0 (ribosomal protein, large, P0) was taken as the housekeeping gene, and analysis was done using the relative expression method. Values are given as fold expression levels ± SEM; n = 3 for each tissue type. The gene of interest, Hist2h3c1, is highlighted by a red box; Hist2h3c1 was found to be the most highly expressed H3.2 encoding gene in the lens. b) Gene expression changes in the embryonic tissues of Aey69 at the embryonic stages of E10.5-E12.5 using the -2ΔΔct method; the respective wild-type tissues were used as the control, and Rplp0 was taken as the housekeeping gene. Values are given as fold expression levels ± SEM. n = 3 for each embryonic stage. Statistically significant differences of the expression levels (p < 0.005) are marked by an asterisk. The mutated gene Hist2h3c1 (red box) was found to be significantly downregulated through these stages.

Microarray analysis of differentially regulated genes in Aey69 embryos. Heatmap of the top analysis-ready genes from our Ingenuity analysis, regulated between Hist2h3c1 mutant embryos and controls. Genes were ordered by fold-change within each stage and relative gene expression values are shown across samples (z-scales to mean expression per row). The downregulated crystallin genes (and Mip) are highlighted in beige.

Lens development in Aey69 mutants. The lens-specific marker CRYAA (a) and CRYGD (b) were used to characterize the early lens from the stages of E11.5-E14.5. At E11.5, no major change was observed in the distribution of crystallins between the wild type and mutant lens (marked by their respective arrows). However, through the stages of E12.5 – E14.5 the arrows highlight clearly the decreased CRYAA and CRYGD expression and a diminishing lens region in the mutant. The bars indicate 100 μm; n = 3 for each embryonic stage; L, lens; R, retina; ON, optic nerve.

GJA8 in early eye development. The immunohistochemical distribution of GJA8 is shown at E11.5-E12.5 in wild type, Aey69 mutant and similar microphthalmic mouse model aphakia. The shrinking lens region is marked in the mutant models by white arrows. No obvious immunohistochemical localization of Gja8 in the mutant eyes at the stages of E11.5-E12.5 was observed. The bars indicate 100 μm; n = 3 for each embryonic stage; L, lens; R, retina; ON, optic nerve.

Changes in the expression patterns of the transcription factors PITX3 and FOXE3 in the Aey69 mutant lens. a) The transcription factor PITX3 was used to characterize the alteration in lens development from E11.5 -E14.5, when the lens structure diminishes. Similar to CRYAA, for PITX3 at E11.5 there was no major change in the distribution in the wild type and mutant lens (marked by their respective white arrows) and through the stages of E12.5 – E14.5 the arrows highlight clearly the diminishing PITX3 expression in the shrinking mutant lens. The bars indicate 100 μm (n = 3 for each embryonic stage). L, lens; R, retina; ON, optic nerve. b) The lens-specific transcription factor FOXE3 was used to identify any disruptions in lens development starting from E11.5. The arrows marking the mutant lens at E11.5 clearly indicate reduced expression of FOXE3 at E11.5. The bars indicate 50 μm; n = 3 for each embryonic stage; L, lens; R, retina; ON, optic nerve.

Disappearing lens vesicle and Ap2α in lens and retina. The apoptotic marker Cleaved Caspase 3 (green) was used to characterize apoptotic events during ocular development from E11.5 -E13.5, when the lens structure diminishes. The arrows marking the mutant lens at E11.5-E12.5 clearly indicate that the apoptotic death of the lens structure. The ocular transcription factor Ap2α (red) was used to characterize transcriptional regulation of ocular development from E11.5 -E13.5, when the lens structure diminishes. The apoptotic process leads to a shrinking lens as it can be observed from the decreased number of Ap2α-positive cells in the subsequent stages. The bars indicate 50 μm.

Retinal development in Aey69 mutants. a) The ganglion cell specific marker BRN3 was used to characterize the early retina developmental changes and associated hyperproliferative events. The arrows in the mutant retina at E11.5 clearly indicate an early overexpression of BRN3-positive retinal cells. This overexpression does not affect the expansion of the BRN3 positive cells to the prospective ganglion cell layer in mutant retina at E15.5 similar to the wild type (marked by arrows in the respective sections). b) OTX2 was used to characterize the early changes in Aey69 mutant retina at the stages of E11-5-E13.5. The results indicate an early appearance of OTX2-positive retinal cells in the mutant at E11.5 and E12.5 (indicated by white arrows at the respective stage). n = 3, for each embryonic stage; bars indicate 100 μm; L, lens; R, retina; ON, optic nerve.

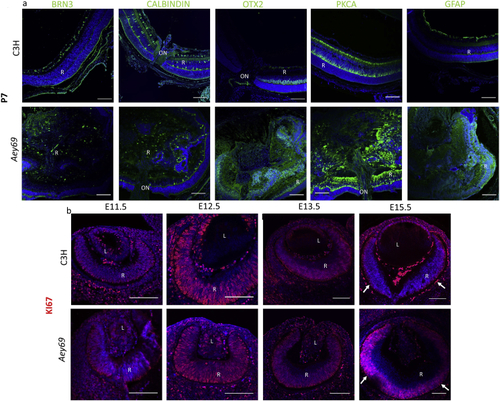
Hyperproliferation in the Aey69 mutant eye. a) Antibodies labeling diverse retinal cell types were used to characterize the retina at P7. The wild-type images clearly indicate that at P7 there is a stratified retina with distinct cell types: Calbindin-positive horizontal and amacrine cells, PKCα-positive bipolar cells, OTX2-positive photoreceptors and bipolar cells, GFAP-positive Müller cells, and BRN3-positive retinal ganglion cells. In the Aey69, these cell types were present covering the entire ‘empty lens area’ of the mutant eye. The bars indicate 50 μm; n = 3 for each embryonic stage; L, lens; R, retina; ON, optic nerve. b) KI67 immunostaining was used to characterize proliferation in the developing eye of wild types and mutants. The results indicate differences in the distribution of KI67 between the wild-type and mutant eyes. At E15.5, in the wild-type retina KI67 positive cell population seems to be restricted to the future outer neuroblastic layer (marked by arrows). However, in the mutant the arrows indicate that the region occupied by the Ki67-stained cells is comparatively larger. The bars indicate 100 μm; n = 3 for each embryonic stage. L, lens; R, retina; ON, optic nerve.

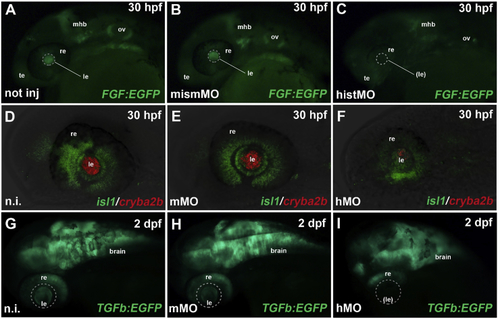
Hist2h3ca1 knock-down affects zebrafish eye development. a–c: After MO-mediated knockdown of zebrafish hist2h3ca1, FGF signaling (green EGFP reporter) was still preserved in telencephalic (te), otic vesicle (ov) and midbrain-hindbrain-boundary (mhb) regions, but lost in the lens (dashed circle) of morphant embryos (c), compared to not injected (a) and mismMO-injected controls (b), analyzed at 30 hpf (hours post-fertilization). re: retina. d–f: At 30 hpf, expression of cryba2b (red) was almost completely lost in the lens (le) of morphants (hMO) (f), compared to not injected (n.i.) (d) and mismatched (mMO) (e) controls, while isl1 expression (green) was still present in the retina (re). g–i: TGFb (TGFβ) signaling (green EGFP reporter) was activated in the brain, retina (re) and lens (le) of not injected and control-injected embryos (g, h), while it was specifically absent in the lens region (dashed circle) of morphant embryos (i) at 2 dpf (day post-fertilization). All panels display lateral views of zebrafish cephalic regions, with anterior to the left. Displayed phenotypes are representative of n = 60 embryos per condition. The scale bars are 100 μm in A and G, 50 μm in D and apply to all images in the same row.

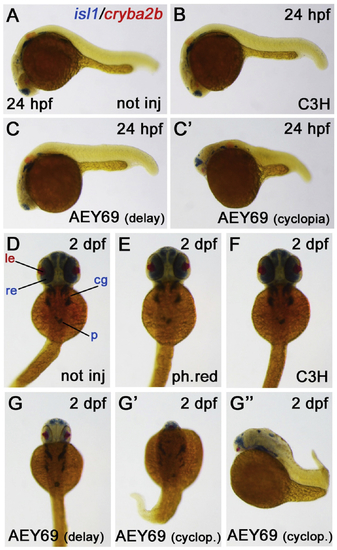
Mutated Hist2h3c1 over-expression perturbs zebrafish development and eye formation. a-c’: Injection of mutated AEY69 Hist2h3c1 mRNA into zebrafish embryos led to developmental delay (c), malformation and cyclopia (c’), while wild-type C3H mRNA was not eliciting any defect (b), compared to not injected controls (a), when analyzed at 24 hpf. d-g’‘: The analysis at 2 dpf confirmed normal and comparable phenotypes in not injected (d), control phenol-red-injected (ph.red) (e) and C3H-injected (f) embryos, while AEY69-injected embryos showed developmental delay (g), malformation and cyclopia (g’, g’‘). The isl1 marker (blue) labels retina (re), cranial ganglia (cg) and pancreas (p), while cryba2b (red) identifies the lens (le) region. a-c’ and g’’ panels display lateral views with anterior to the left; d-g’ panels display dorsal views with anterior to the top. Displayed phenotypes are representative of n = 60 embryos per condition. Scale bar in A is 200 μm and applies to all images.

ZFIN is incorporating published figure images and captions as part of an ongoing project. Figures from some publications have not yet been curated, or are not available for display because of copyright restrictions.

Acknowledgments
This image is the copyrighted work of the attributed author or publisher, and ZFIN has permission only to display this image to its users. Additional permissions should be obtained from the applicable author or publisher of the image.

Reprinted from Experimental Eye Research, 188, Vetrivel, S., Tiso, N., Kügler, A., Irmler, M., Horsch, M., Beckers, J., Hladik, D., Giesert, F., Gailus-Durner, V., Fuchs, H., Sabrautzki, S., German Mouse Clinic, Helmholtz Zentrum München, German Research Center for Environmental Health GmbH, Neuherberg, Germany, Adler, T., Treise, I., Busch, D.H., Aguilar-Pimentel, A., Ollert, M., Götz, A., Amarie, O.V., Stoeger, T., Schulz, H., Becker, L., Klopstock, T., Schrewe, A., Spielmann, N., Bekeredjian, R., Garrett, L., Hölter, S.M., Zimprich, A., Wurst, W., Mayer-Kuckuk, P., Hans, W., Rozman, J., Klingenspor, M., Neff, F., da Silva-Buttkus, P., Calzada-Wack, J., Rácz, I., Zimmer, A., Rathkolb, B., Wolf, E., Prehn, C., Adamski, J., Östereicher, M., Miller, G., Steinkamp, R., Lengger, C., Maier, H., Stoeger, C., Leuchtenberger, S., Gailus-Durner, V., Fuchs, H., Hrabě de Angelis, M., Hrabě de Angelis, M., Graw, J., Mutation in the mouse histone gene Hist2h3c1 leads to degeneration of the lens vesicle and severe microphthalmia, 107632, Copyright (2019) with permission from Elsevier. Full text @ Exp. Eye. Res.