
- Title
-
Intestinal dysmotility in a zebrafish (Danio rerio) shank3a;shank3b mutant model of autism
- Authors
- James, D.M., Kozol, R.A., Kajiwara, Y., Wahl, A.L., Storrs, E.C., Buxbaum, J.D., Klein, M., Moshiree, B., Dallman, J.E.
- Source
- Full text @ Mol Autism
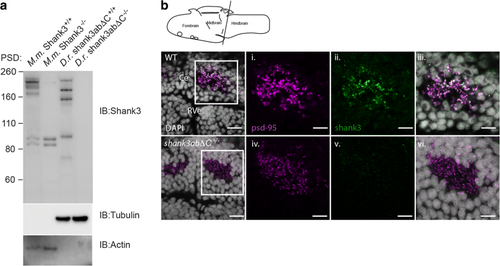
Zebrafish Shank3ab protein shares complex isoform expression with mammals and shows expression in the cerebellum. a Shank3 western blots of postsynaptic densities (PSD) isolated from mouse (M.m) and zebrafish (D.r.) show similar complex isoform expression. Molecular marker weight is expressed in kilodaltons. Tubulin and actin expression were used as loading controls for zebrafish and mouse immunoblots, respectively. Loss of Shank3ab staining in IHC and the western blot supports the immunoreactive specificity of Shank3 antibody. b Shank3ab protein is expressed as distinct overlapping puncta with PSD-95 in the cerebellum from larvae 6 days post-fertilization. Transverse cerebellar sections (see diagram) with enlarged insets show neuropil area dorsal to the rhombencephalic ventricle (RVe). Scale bar represents 10 μm for the first column and 5 μm for the insets (i–vi) EXPRESSION / LABELING:
|

shank3abΔC−/− and shank3abΔC+/− larvae have reduced peristaltic frequencies and DT motility compared to WT. a Representative image of a zebrafish embedded for analysis, with the area of analysis (AOA) denoted by the red lines and the regions of evaluation denoted by the cyan boxes (1–60). The AOA was manually drawn in, and the program automatically fills a set number of recording regions along the AOA. For our work, this number was set at 30 dorsal and 30 ventral, but the number and size of the boxes can be adjusted if necessary. b Representative WT data output, showing output from all regions of evaluation within the AOA; as the peristaltic contraction moves down the DT tract, the Igor Pro program registers the change in pixel intensity. c Representative image of an individual analysis readout for a WT larva, with the change in pixel intensity (y-axis) measured as time progresses (x-axis). Igor Pro can separate individual regions of evaluation within the AOA and give data on peristaltic periodicity in a specific region, allowing users to get overall averages throughout multiple regions within the AOA. d Representative image of an individual analysis readout for a shank3abΔC +/− larvae, note the larger space between peaks, indicating reduced peristaltic frequencies. e WT larvae are shown to have peristaltic rates significantly (p < 0.0001) more frequent than that of shank3abΔC mutants. F0 shank3b larvae are significantly slower than WT, while F0, shank3abΔC +/− and ΔC −/− show no significant difference between each other. Each point represents an average frequency from a 7-day-old larva PHENOTYPE:
|
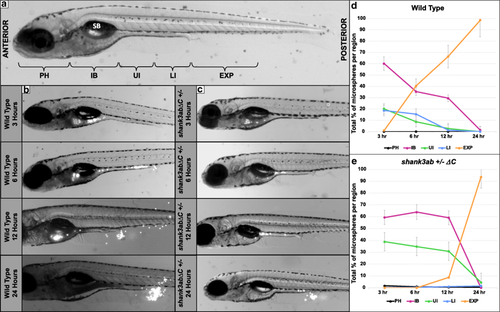
DT transit time of fluorescent beads is prolonged in shank3abΔC+/− mutants compared to WT larvae. a Regions of the DT analyzed for fluorescent bead occupancy are indicated on a 7-day-old zebrafish larva. Beads were tracked as they passed through five key regions: PH (pharynx), IB (intestinal bulb), UI (upper intestine), LI (lower intestine), and EX (expelled). The swim bladder (SB) is labeled for reference. b Images of a representative WT fish at 3, 6, 12, and 24 h post-feed. Beads appear white and can be seen throughout the DT and collecting near the anus post-expulsion. c Images of a representative shank3abΔC +/− larva at 3, 6, 12, and 24 h post-feed. d Graph of bead distribution per time point for WT fish. Each point represents the average +/− standard error of the percentage of total beads held by each region (PH, IB, UI, LI, or EXP) over time (n = 13). e Graph of shank3abΔC +/− mutant average +/− standard error bead distribution over time (n = 15) PHENOTYPE:
|

Full-length human SHANK3 mRNA partially rescues transit time in shank3abΔC +/− larvae. a When measuring the total percentage of fluorescent beads within the intestinal bulb (highlighted region of analysis for in magenta), total content of the long isoform (5t) rescue (dark gray) decreases at a rate quicker than the unrescued shank3abΔC +/− (black) but not as quickly as the WT (light gray). Significant differences of intestinal bulb emptying (total intestinal bulb content) were found between the long isoform rescued and unrescued shank3abΔC +/− larvae at 12 h (p < 0.006) and 24 h (p < 0.03), and between WT and unrescued shank3abΔC +/− at 6 h (p < 0.02) and 12 h (p < 0.01). bFluorescent microbead expulsion (analogous to completed digestion; highlighted region of analysis in orange) was not rescued, however, and the long isoform rescued larvae showed expulsion rates closer to shank3abΔC +/− than that of WT. Significant differences were found at 6 h between WT, the long isoform rescue, and unrescued shank3abΔC +/− (p < 0.006), at 12 h between WT and unrescued shank3abΔC +/− (p < 0.001), WT and the long isoform rescue (p < 0.001), and at 24 h between unrescued shank3abΔC +/− and the long isoform rescue larvae (p < 0.01), and WT and the long isoform rescue larvae (p < 0.005). ci Graph of bead distribution per time period for the long isoform (5t) rescue larvae (n = 19) and cii short isoform (32t) rescue larvae (n = 6). Each point represents the average +/− standard error percentage of total beads held by each region |
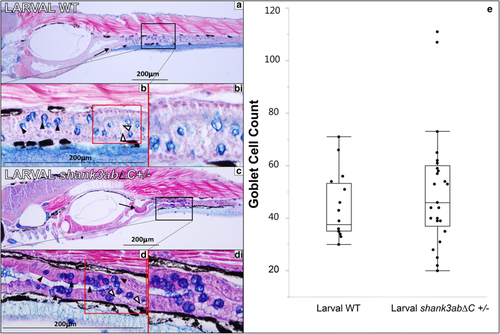
Histology of larval WT and shank3abΔC+/− mutants (n = 25 for shank3abΔC +/−n = 15 for WT). Black boxes in a and c indicate regions shown at 40× magnification, while red boxes in b and d indicate regions of magnified insets in bi and di. a 10× magnification of longitudinal sections through 7 dpf WT fish (anterior left to posterior right); sections were stained with alcian blue and Eosin B. Sections show a well-defined polarized epithelium, with folding beginning in the intestinal bulb and extending into the upper intestine (black arrow). b The goblet cells are stained dark blue (black arrowheads) and intestines (stained purple) are clearly visible, while mucous production can be seen in the luminal space, stained light blue. bi This magnified inset from b shows enterocytes with large supranuclear vesicles (white arrowheads). c 10× magnification of 5-μm sections through 7 dpf shank3abΔC +/− mutants. Mucous production can be seen in luminal space shown in 40× magnification of d, along with goblet cells (black arrowheads) and intestinal lumen. di Similar to what is seen in WT fish, shank3abΔC+/− mutants display enterocytes with large supranuclear vesicles (white arrowheads). e Comparison of WT and shank3abΔC +/− mutant goblet cell count; no significant difference was found at 7 dpf PHENOTYPE:
|
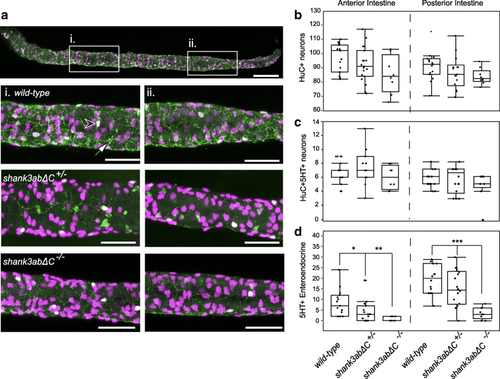
Shank3abΔC mutants have a reduction in enteroendocrine cells. a Anterior (i.) and posterior (ii.) regions were sampled to quantify the number of enteric neurons (HuC, magenta), serotonin enteric neurons (HuC+/5-HT+, white, black arrowhead), and enteroendocrine cells (5-HT+, green, white arrow). Shank3abΔC mutants did not show a significant decrease in either b enteric neurons or c serotonin positive enteric neurons. d Serotonin positive enteroendocrine cells were significantly decreased in shank3abΔC mutants for both anterior and posterior regions. WT, n = 15;shank3abΔC +/−, n = 19; shank3abΔC −/−, n = 9. Scale bars represent 100 μm (a) and 50 μm (i, ii) |
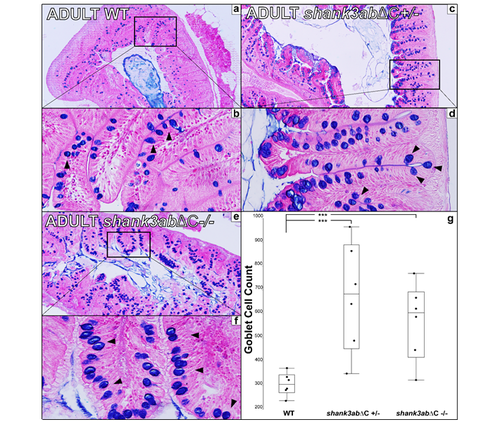
Figure S2 a Transverse 5μm section of adult WT upper intestinal tissue stained with alcian blue and Eosin B (n=6 for WT, n=6 for shank3abΔC +/- and n=6 for shank3abΔC -/-). b 40x magnification shows dense plicae that extend to the point of nearly occluding the luminal space. c,d In shank3abΔC +/- upper intestinal tissue, increased counts of goblet cells (black arrowheads) suggest inflammation. e,f Homozygous shank3abΔC -/- adults also show increased goblet cell count. Comparison of goblet cell counts in WT, shank3abΔC +/-, and shank3abΔC -/- adults show a significant increase in the number of goblet cells in both shank3abΔC +/- and shank3abΔC -/- adults. WT and shank3abΔC -/- comparison (p<0.0138) and WT and shank3abΔC +/- comparison (p<0.0015). PHENOTYPE:
|