
- Title
-
In vivo pro-angiogenic effects of dracorhodin perchlorate in zebrafish embryos: A novel bioactivity evaluation platform for commercial dragon blood samples
- Authors
- Krishnaraj, P., Chang, Y., Ho, T.J., Lu, N.C., Lin, M.D., Chen, H.P.
- Source
- Full text @ J Food Drug Anal
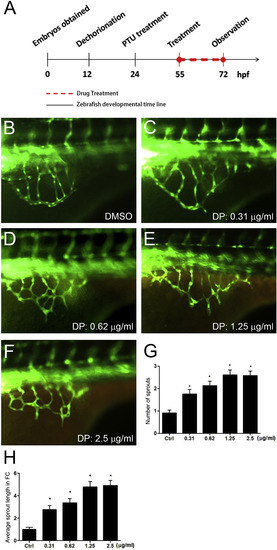
Effect of Dracorhodin perchlorate on sub-intestinal veins of zebrafish embryos. (A) Time line of zebrafish embryonic development showing the experimental procedures at different time points. (B) Sub-intestinal veins (SIV) of control embryo treated with 0.1% DMSO. (C–F) SIV of 72 hpf zebrafish embryos treated with (C) 0.31, (D) 0.62, (E) 1.25, and (F) 2.5 μg/ml of dracorhodin perchlorate (DP). White arrows indicate extra sprouts. (G) Quantification of average sprout numbers. DP increased the average sprout number in a dose-dependent manner between 0.31 and 1.25 and plateaued at 1.25–2.5 μg/ml. (H) Quantification of relative fold changes in sprout length with respect to controls. DP increases the sprout length in a dose-dependent manner. Data is expressed as a mean ± SEM from three independent experiments. Asterisks indicates P < 0.05 compared with the control group.
|
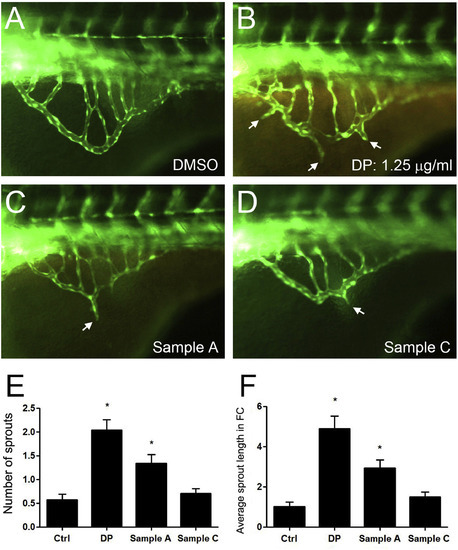
Comparisons of vascular phenotypes between commercially available dragon blood and DP. (A) SIV of an embryo treated with 0.1% DMSO. (B) SIV of an embryo treated with 1.25 μg/ml DP. (C) SIV of an embryo treated with a crude extract of Sample A containing 1.25 μg/ml dracorhodin. (D) SIV of an embryo treated with a crude extract of Sample C containing 1.25 μg/ml dracorhodin. (E) Quantification of average sprout number. (F) Relative fold changes in the sprout length with respect to controls. White arrows indicate extra sprouts. Quantification of vascular phenotypes expressed as a mean ± SEM. Asterisk indicates P < 0.05 compared with the control group.
|