
|
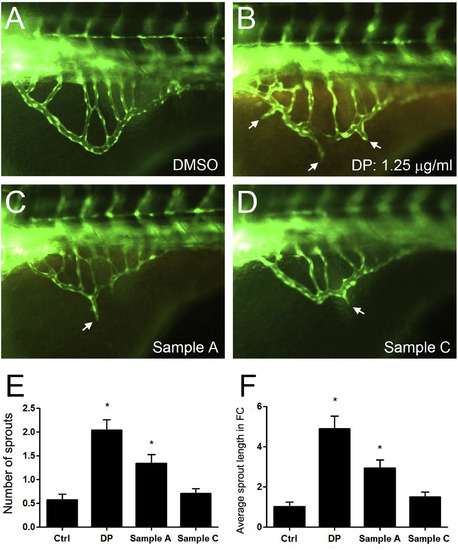
Fig. 4
Comparisons of vascular phenotypes between commercially available dragon blood and DP. (A) SIV of an embryo treated with 0.1% DMSO. (B) SIV of an embryo treated with 1.25 μg/ml DP. (C) SIV of an embryo treated with a crude extract of Sample A containing 1.25 μg/ml dracorhodin. (D) SIV of an embryo treated with a crude extract of Sample C containing 1.25 μg/ml dracorhodin. (E) Quantification of average sprout number. (F) Relative fold changes in the sprout length with respect to controls. White arrows indicate extra sprouts. Quantification of vascular phenotypes expressed as a mean ± SEM. Asterisk indicates P < 0.05 compared with the control group.