
|
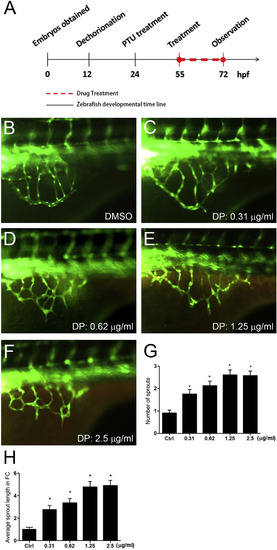
Fig. 2
Effect of Dracorhodin perchlorate on sub-intestinal veins of zebrafish embryos. (A) Time line of zebrafish embryonic development showing the experimental procedures at different time points. (B) Sub-intestinal veins (SIV) of control embryo treated with 0.1% DMSO. (C–F) SIV of 72 hpf zebrafish embryos treated with (C) 0.31, (D) 0.62, (E) 1.25, and (F) 2.5 μg/ml of dracorhodin perchlorate (DP). White arrows indicate extra sprouts. (G) Quantification of average sprout numbers. DP increased the average sprout number in a dose-dependent manner between 0.31 and 1.25 and plateaued at 1.25–2.5 μg/ml. (H) Quantification of relative fold changes in sprout length with respect to controls. DP increases the sprout length in a dose-dependent manner. Data is expressed as a mean ± SEM from three independent experiments. Asterisks indicates P < 0.05 compared with the control group.