
- Title
-
The Hippo Pathway Regulates Caveolae Expression and Mediates Flow Response via Caveolae
- Authors
- Rausch, V., Bostrom, J.R., Park, J., Bravo, I.R., Feng, Y., Hay, D.C., Link, B.A., Hansen, C.G.
- Source
- Full text @ Curr. Biol.

YAP/TAZ Are Necessary for Caveolar Protein Expression (A) Confocal images of wild-type (WT) HEK293A cells labeled for DAPI (blue), YAP/TAZ (red), and CAVEOLIN1 (CAV1) (green). (B and C) YAP/TAZ KO cells (Y/T KO) (B) and LATS1/2 KO (L1/L2 KO) (C) labeled and imaged as cells in (A). Scale bars (A–C) represent 30 μm. (A)–(C) are related to (D) Dot plot of quantified CAV1 levels from images, as shown in (A)–(C). In Y/T KO (red), WT (black), and L1/L2 KO (blue) cells, each dot represents one cell. Means ± SEM. (E) Dot plot of CAVIN1 levels from images as shown in (F) Western blots from Y/T KO, WT, and L1/L2 KO HEK293A cells ( (G) PhosTag gel-based western blots probed against YAP from cell lysates as in (F) ( (H) Mixed cell culture of Y/T KO and WT HEK293A cells were fixed and labeled for YAP/TAZ (red), CAV1 (green), and DAPI (blue). Arrows: examples of Y/T KO cells. Note, cells with no YAP/TAZ signal have low CAV1 signal. Scale bar represents 30 μm. (I) Close up of cells from red box in (H). (J) Dot plot of CAV1 levels in mixed cell populations of Y/T KO and WT cells analyzed in images as shown in (H). Each dot represents one cell. Means ± SEM. (K) Mixed cell population as in (H) labeled for YAP/TAZ (red), CAVIN1 (green), and DAPI (blue). Arrows: examples of Y/T KO cells. Zoomed-out image is in (L) Dot plot of CAVIN1 levels in mixed populations of Y/T KO and WT cells carried out on images as shown in (K). Means ± SEM. (M) Cells as in (H), labeled for YAP (green), CAVEOLIN2 (CAV2) (red), and DAPI (blue). Zoomed-out image is in Scale bars in (I), (K), and (M) are 15 μm. Further related is |
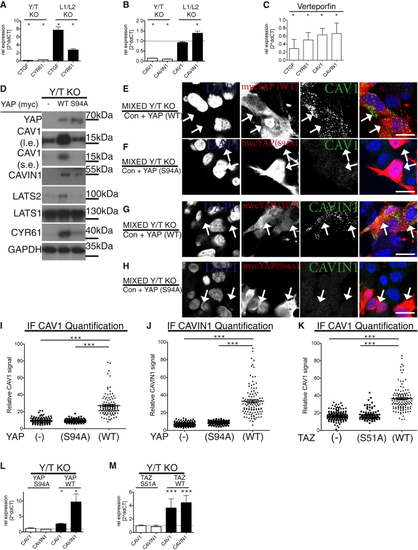
(A) qPCR analysis of established YAP/TAZ targets. mRNA from Y/T KO and L1/L2 KO HEK293A cells compared to WT HEK293A cells ( (B) qPCR data as in (A), analyzed for the expression of (C) Verteporfin-treated WT HEK293A cells analyzed by qPCR. Inhibition of the interaction between YAP-TEAD reduces expression of caveolar genes. Means ± SD. (D) Western blots of lysates from Y/T KO cells stably re-expressing either control plasmid, myc-tagged WT, or S94A mutant YAP. l.e., long exposure; s.e., short exposure. Note, re-expression of WT YAP, but not S94A mutant, deficient in TEAD binding, restores expression of caveolar as well as established YAP/TAZ-TEAD target genes, (E and F) Mixed population of Y/T KO cells expressing myc-tagged YAP or empty vector ( (G and H) Mixed cell culture of Y/T KO cells expressing either vector control or myc-tagged YAP ( Arrows in (E)–(H) highlight examples of myc-YAP-expressing cells. Scale bars (E)–(H) represent 15 μm. Note, only YAP WT induces expression of CAV1 and CAVIN1. (I) Dot plot of CAV1 levels from images, as shown in (E) and (F). Each dot represents one cell. Means ± SEM. (J) Dot plot of CAVIN1 levels from images, as shown in (G) and (H). Each dot represents one cell. Means ± SEM. (K) Dot plot of CAV1 levels from mixed Y/T KO cell population expressing vector control and TAZ (WT) or TAZ (S51A) labeled for CAV1 and TAZ from images as shown in (L and M) qPCR data from myc-tagged WT or S94A YAP compared to vector control expressing Y/T KO cells (L) and WT or S51A TAZ compared to vector control expressing Y/T KO cells levels (M). Means ± SD. |
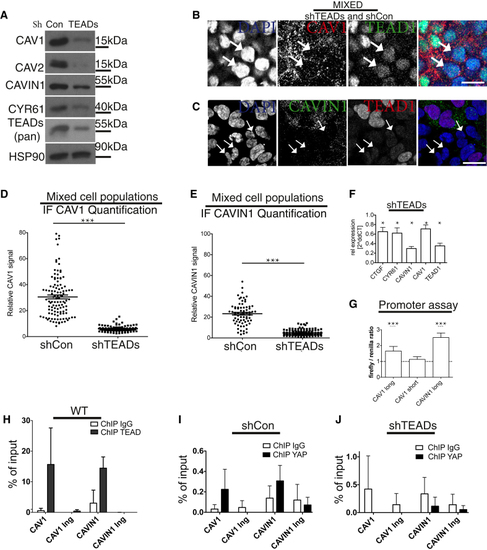
(A) Western blots of lysates from shTEADs and shCon HEK293A cells. (B) Mixed cell population of shTEADs and shCon HEK293A cells labeled for DAPI (blue), CAV1 (red), and TEAD1 (green). Discrete cell populations are shown in (C) Mixed cell population of shTEADs and shCon HEK293A cells labeled for DAPI (blue), TEAD1 (red), and CAVIN1 (green). Discrete cell populations are shown in Arrows in (B) and (C): examples of shTEADs cells. Scale bars in (B) and (C) represent 15 μm. (D and E) Dot plot of CAV1 levels from images, as shown in (B) ( (F) qPCR data from cells as in (A) (related to (G) YAP drives (H) Real-time PCR analysis of TEAD1 chromatin immunoprecipitation (ChIP) in HEK293A cells. The precipitated DNA was quantitated using primers specific for a promoter region or a control in-gene (Ing) region. Data are means ± SD of triplicates from a representative experiment. Endogenous TEAD1 binds to both (I and J) YAP ChIP for |

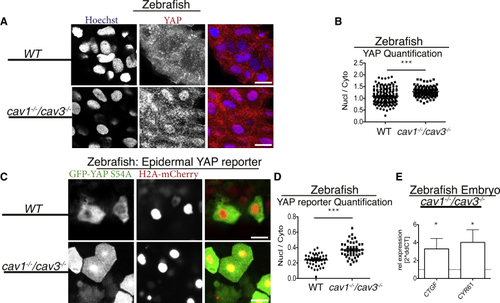
YAP/TAZ Activity Dictates Caveolar Protein Levels (A) Dot plots of (B) Western blots from YAP KO U2OS cells with stable shRNA-induced knockdown of (C) Western blots from TAZ KO U2OS cells with stable knockdown of (D) Western blots from NF2 KO and WT U2OS cells ( (E and F) Confocal image of U2OS WT (E) and NF2 KO cells labeled for YAP/TAZ (green) and DAPI (blue; F). Scale bars represent 20 μm. (G) Dot blots of nuclear-to-cytoplasmic ratio of YAP/TAZ, quantified of images as in (E) and (F). Each dot represents one cell. Means ± SEM. (H) Cell lysates from WT, NF2 KO cells exogenously re-expressing NF2, or NF2 KO control cells were separated in a PhosTag gel and probed for YAP. (I) Lysates, as in (H), separated on a conventional SDS-gel and processed for western blotting. (J) qPCR data from NF2 re-expressors, relative to NF2 KO U2OS control cells. NF2 re-expression reduces expression of (K) qPCR data from NF2 KO U2OS shTEADs relative to control cells. (L) Micrographs from epidermis cells from WT zebrafish embryos. Arrows: examples of caveolae at the plasma membrane. (M) Micrographs from epidermis cells from mutant ( (N) Quantification of caveolae from micrographs; each dot represents data from one fish embryo. Means ± SEM. (O) qPCR analysis of zebrafish from 5 embryos of each genotype. Means ± SD. |
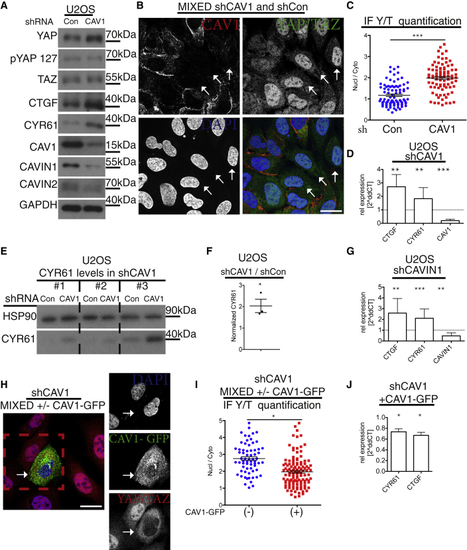
CAV1 Is a Negative Regulator of YAP/TAZ (A) Western blot analysis of shRNA-induced (B) Confocal image of mixed cell population of shCAV1 and shCon cells labeled for YAP/TAZ (green), CAV1 (red), and DAPI (blue; (C) Dot plots of quantification of nuclear-to-cytoplasmic ratio of YAP/TAZ from images as in (B). Each dot represents one cell. Means ± SEM. (D) qPCR analysis of shCAV1 cells. Means ± SD. (E) Western blots from U2OS shCon and shCAV1 cell lysates from three independent experiments (nos. 1–3). (F) Quantification from blots in (E) of normalized CYR61 values in U2OS shCAV1 cells compared to shCon cells. Student’s t test. Means ± SEM; shCAV1 cells have higher levels of CYR61 than control cells. (G) qPCR analysis of shCAVIN1 U2OS cells compared to control. Means ± SD. (H) Confocal image of mixed cell population of shCAV1 (empty vector) and shCAV1 (CAV1-GFP re-expressor) cells, labeled for YAP/TAZ (red), GFP (green), and DAPI (blue). Re-expression of CAV1 in shCAV1 cells rescues hyperactivation of YAP (related to (I) Dot plot of quantification of nuclear-to-cytoplasmic ratio of YAP/TAZ from images as in (E). Each dot represents one cell. Means ± SEM. (J) qPCR analysis of CAV1-GFP-expressing shCAV1 cell line compared to control shCAV1. Means ± SD. Further related to this figure are |
CAVEOLINs Are Negative Regulators of YAP/TAZ (A) Images of epithelial cells from WT and (B) Quantification of cellular nuclear-to-cytoplasmic ratio from (C) Images from (D) Quantification of nuclear-to-cytoplasmic ratio from (E) qPCR analysis from four-day-old |

Caveolae Facilitate YAP/TAZ-Mediated Flow Response (A) Confluent HEK293A cells were kept in chambers with different flow speeds for 18 hr. YAP/TAZ KO cells were kept at high flow only. Western blot of cell lysates separated on a PhosTag gel and probed for YAP is shown. Note the dephosphorylation (downshift of YAP) and therefore predicted activation of YAP upon flow. (B) Western blots of cell lysates as in (A). Note the increase in CYR61 protein upon flow in WT cells. (C) Confocal images of cells grown without (−) or with flow at 2.1 × 10⁻⁵ Dyn/cm2 (+). Cells labeled for YAP (green) and CAV1 (red) are shown. Scale bar represents 20 μm. (D) Dot plot representing quantification of nuclear-to-cytoplasmic ratio of YAP/TAZ localization from images as in (C). Each dot represents one cell. Means ± SEM. (E) qPCR analysis of HEK293A WT cells kept at either 0 or 2.1 × 10⁻⁵ Dyn/cm2. (F) Western blot of cell lysates from either control or shCAV1 cells kept at either 0 (− flow) or at 2.1 × 10⁻⁵ Dyn/cm2 (+ flow). Note induction of CYR61 upon flow in WT cells (related to (G) Quantification of CYR61 levels from western blots as in (F), normalized to HSP90 levels. n = 3; means ± SD. (H) Relative fold induction of target gene expression in shCAV1 upon flow compared to control cells. Means ± SD. (I) Dot plots of YAP localization from images of cells at steady state. Each dot represents one cell. Means ± SEM. (J) Dot plots of normalized values of flow-induced (2.1 × 10⁻⁵ Dyn/cm2) YAP nuclear localization. Each dot represents one cell. Means ± SEM. (K) Relative fold induction of target gene expression in two separate CAV1 KO clones upon flow was compared to control cells. Means ± SD. Flow-mediated induction of Further related to this figure are |