
- Title
-
Enhancer Trapping and Annotation in Zebrafish Mediated with Sleeping Beauty, piggyBac and Tol2 Transposons
- Authors
- Shen, D., Xue, S., Chan, S., Sang, Y., Wang, S., Wang, Y., Chen, C., Gao, B., Mueller, F., Song, C.
- Source
- Full text @ Genes (Basel)
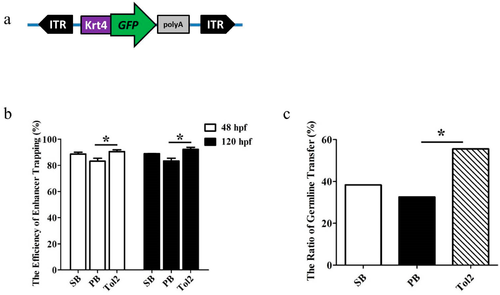
Green fluorescent protein (GFP) expression efficiency and germline transfer efficiency of enhancer trapping (ET) based on sleeping beauty (SB), piggyBa (PB) and Tol2 transposons in zebrafish. (a) Schematic of the transposon-based ET cassette (not to scale). The cassette includes two inverted repeat sequences (SB, PB, or Tol2 inverse terminal repeats (ITRs)), and a minimal Krt4 promoter, GFP, and β-globin polyA signal; (b) GFP expression efficiency was measured by GFP screen at 48 and 120 h postfertilization (hpf) after co-injection of a fixed amount of transposon plasmid with the corresponding transposase mRNA into zebrafish embryos. The total number of injected embryos was 1378 in SB, 1276 in PB, 1524 in Tol2. Error bars represent SD; (c) germline efficiency was measured by crossing the GFP-positive founders with wild-type (WT) fish. Significant difference was detected using a χ-squared test; asterisk indicates p < 0.05. |
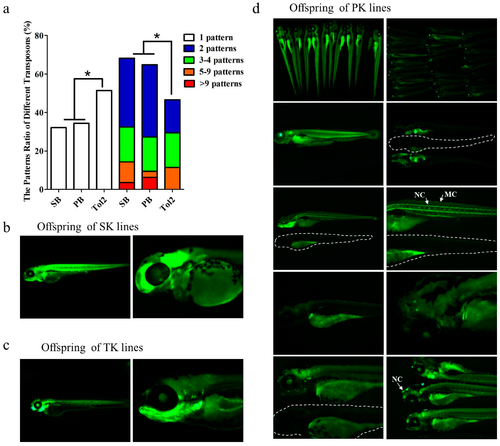
ET pattern difference based on SB, PB and Tol2 transposons in zebrafish. (a) Pattern difference was measured by counting the different patterns of offspring at five days postfertilization (dpf) from each single founder. Significant difference was detected using a χ-squared test; asterisk indicates p < 0.05; (b–d) Offspring patterns of lines generated by SK (ET lines generated by the SB transposon), TK (ET lines generated by the Tol2 transposon), and PK (ET lines generated by the PB transposon). In various expression patterns, specific expression in tissues such as eyes, kidney tubes, muscles, and swim bladders could be detected, as well as specific expression patterns in various cells such as nerve cells (NC) and muscle cells (MC). White dotted lines in (d) indicate the WT fish. |
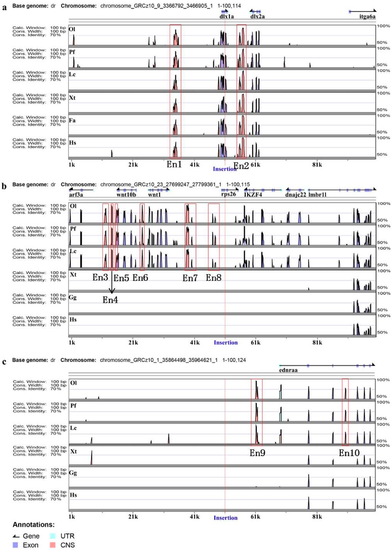
Enhancer annotation of three ET lines. Distribution in the region between 50 kb upstream and 50 kb downstream of insertion. Genomic sequences from Danio rerio (Dr), Oryzias latipes (Ol), Poecilia formosa (Pf), Xenopus tropicalis (Xt), Ficedula albicollis (Fa), Gallus gallus (Gg) and Homo sapiens (Hs) were analyzed in the VISTA browser (https://enhancer.lbl.gov/), and 10 enhancers (Ens) were predicted in zebrafish genome as indicated (red frame); the location of each insertion site is marked with a red line. (a–c) represent zebrafish lines TK1, TK4 and SK3, respectively. |
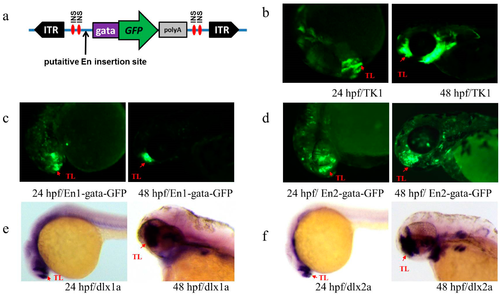
(a) Transposon-mediated En test vector cassette. The cassette contains an En test box flanked by two ITRs, the ITR represents Tol2 inverted repeat sequences, and the En test box contains a minimal gata promoter, GFP, and β-globin polyA signal flanked with two insulators. INS represents a single insulator; (b–f) Expression patterns of Ens and endogenous dlx1a and dlx2a in TK1; (b) GFP expression of line TK1 at 24 and 48 hpf; (c,d) GFP expression of the embryos injected with plasmids carrying En1 and En2 at 24 and 48 hpf, respectively; (e,f) expression of dlx1a and dlx2a at 24 and 48 hpf, respectively. Red arrows indicate similar patterns in telencephalon (TL). |
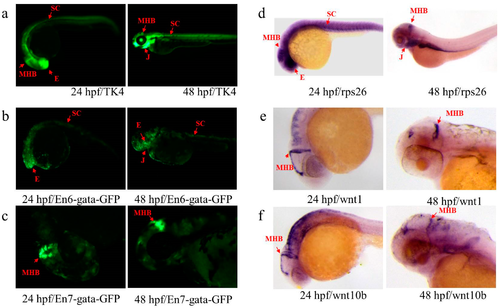
Expression patterns of En and endogenous rps26, wnt1 and wnt10b in TK4. (a) GFP expression of line TK4 at 24 and 48 hpf; (b,c) GFP expression of the embryos injected with plasmids carrying En6 and En7 at 24 and 48 hpf, respectively; (d–f) gene expression of rps26, wnt1 and wnt10b at 24 and 48 hpf, respectively. Red arrows indicate similar patterns in eye (E), midbrain and hindbrain boundary (MHB), spinal cord (SC) and jaw (J). |
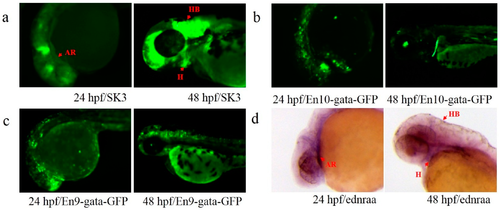
Expression patterns of En and endogenous ednraa in SK3. (a) GFP expression of line SK3 at 24 and 48 hpf; (b,c) GFP expression of the embryos injected with plasmids carrying En10 and En9 at 24 and 48 hpf; (d) gene expression of ednraa at 24 and 48 hpf. Red arrows indicate the similar patterns in arches (AR), hindbrain (HB) and heart (H). |
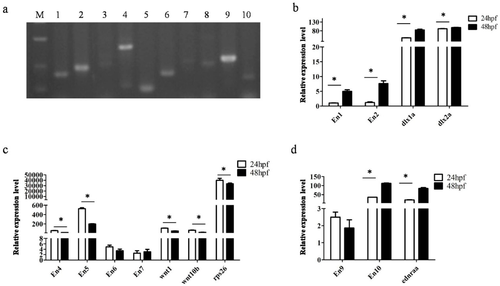
Expression of Ens. (a) En expression confirmed by RT-PCR, numbers 1–10 represented En1-10; M: DL500 DNA marker; (b–d) relative quantification of expressions of En and endogenous genes by qPCR at 24 and 48 hpf; error bars represent SD. |