
IMAGE
Fig. 3
- ID
- ZDB-IMAGE-210205-12
- Publication
- Shen et al., 2018 - Enhancer Trapping and Annotation in Zebrafish Mediated with Sleeping Beauty, piggyBac and Tol2 Transposons
- All Figures
- Figures for Shen et al., 2018
Image
|
Figure Caption
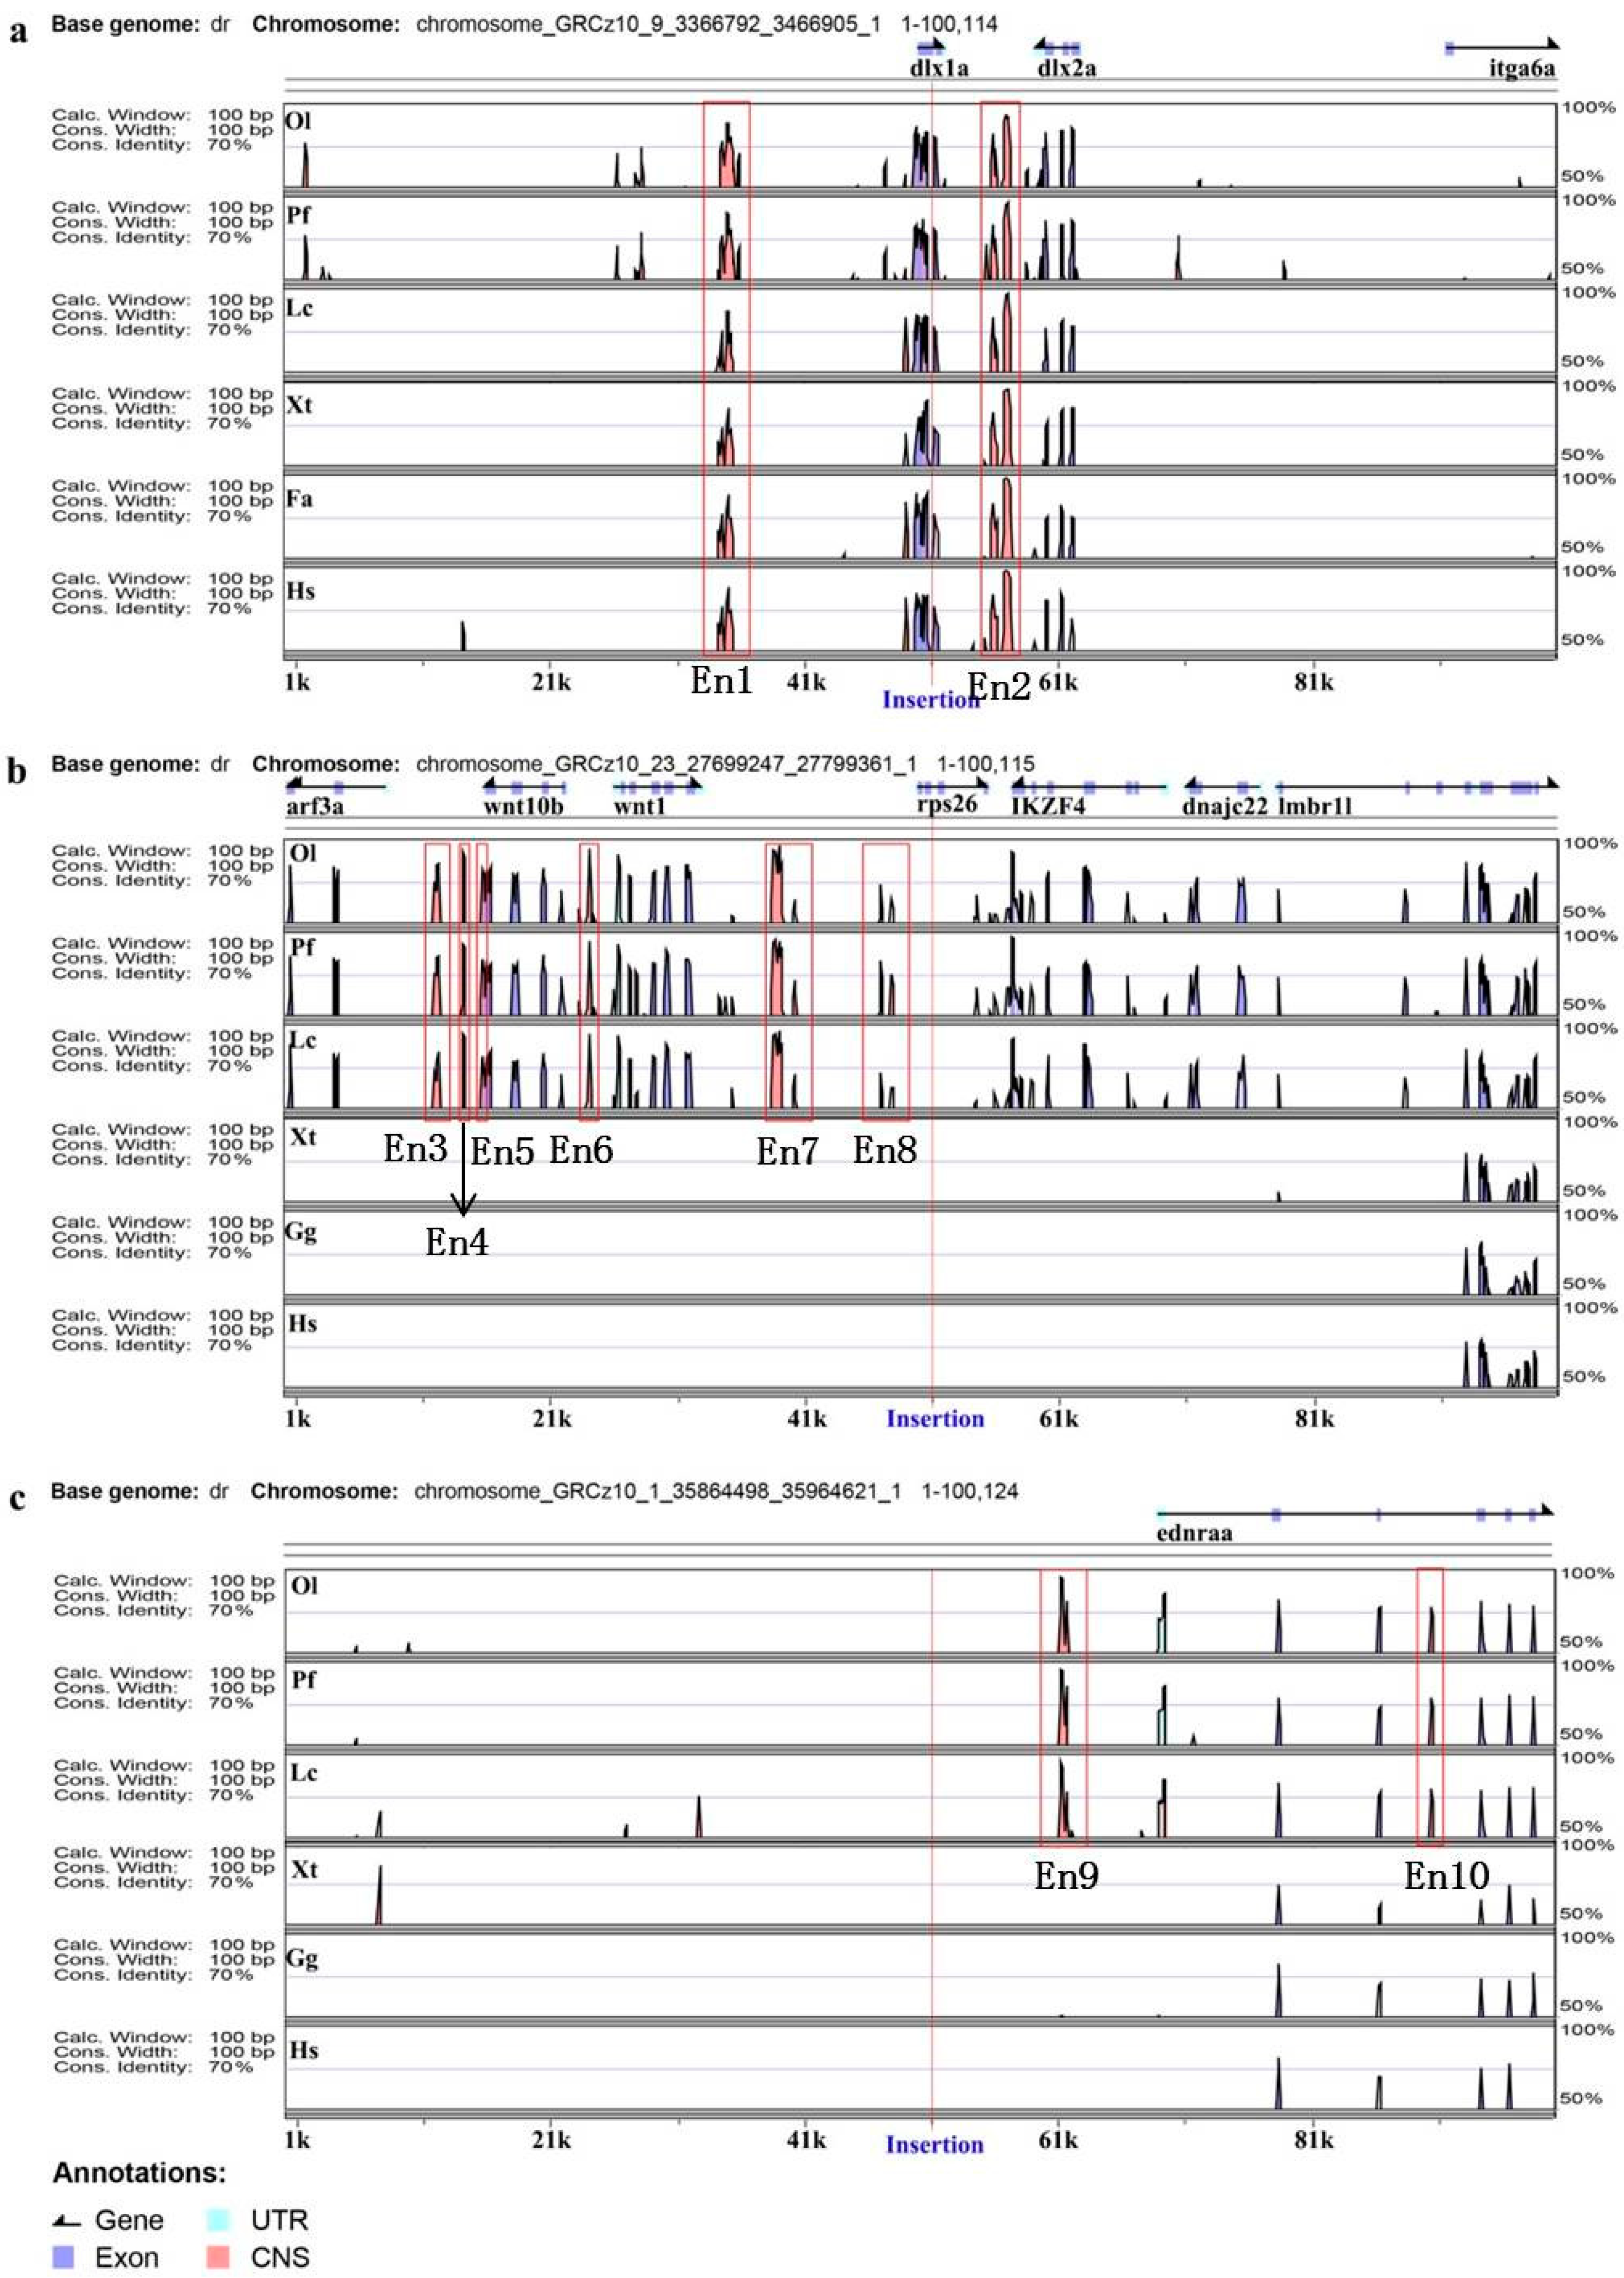
Fig. 3 Enhancer annotation of three ET lines. Distribution in the region between 50 kb upstream and 50 kb downstream of insertion. Genomic sequences from Danio rerio (Dr), Oryzias latipes (Ol), Poecilia formosa (Pf), Xenopus tropicalis (Xt), Ficedula albicollis (Fa), Gallus gallus (Gg) and Homo sapiens (Hs) were analyzed in the VISTA browser (https://enhancer.lbl.gov/), and 10 enhancers (Ens) were predicted in zebrafish genome as indicated (red frame); the location of each insertion site is marked with a red line. (a–c) represent zebrafish lines TK1, TK4 and SK3, respectively.
Acknowledgments
This image is the copyrighted work of the attributed author or publisher, and
ZFIN has permission only to display this image to its users.
Additional permissions should be obtained from the applicable author or publisher of the image.
Full text @ Genes (Basel)