
- Title
-
Polydatin alleviated alcoholic liver injury in zebrafish larvae through ameliorating lipid metabolism and oxidative stress
- Authors
- Lai, Y., Zhou, C., Huang, P., Dong, Z., Mo, C., Xie, L., Lin, H., Zhou, Z., Deng, G., Liu, Y., Chen, Y., Huang, S., Wu, Z., Sun, X., Gao, L., Lv, Z.
- Source
- Full text @ J. Pharmacol. Sci.

Zebrafish larvae exposed to ethanol induced fatty liver disease. (A) H&E staining showed disarrangement of cell cords and lipid vacuolation in ethanol-exposure group. (B)Whole-mount Oil Red O staining defined positive for hepatic steatosis in ethanol-exposed larvae. (C) The positive staining area was quantified (n = 7/group, 2 experiments). Data are presented as the mean ± SEM; ∗P < 0.05 vs. control group. (D) Nile Red staining revealed the hepatomegaly and intracellular lipid droplets in ethanol interventioned Tg(lfabp10α-eGFP) larvae. Dotted line outlines the liver. |

Polydatin alleviated hepatic steatosis in zebrafish larvae caused by ethanol. (A) H&E staining showed the pathological changes in liver. (B) Nile Red staining was applied to assess whether polydatin inhibited development of hepatic steatosis. (C-D) Oil Red O staining images and quantification were used to detect whether polydatin reduced lipid accumulation in hepatic parenchyma. (n = 10/group, 2 experiments). Data are presented as the mean ± SEM; ∗P < 0.05 vs. control group; #P < 0.05 vs. ethanol group. Dotted line outlines the liver. |
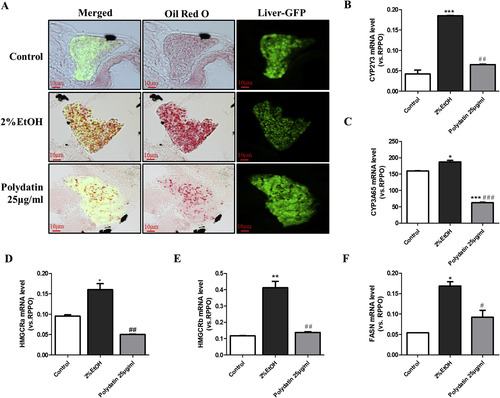
Polydatin accelerated ethanol and lipid metabolism in zebrafish larvae. (A) Frozen section of Oil Red O staining presented that polydatin suppressed lipid deposition in larvae liver. (B-C) qRT-PCR analysis of ethanol metabolism relevant genes, CYP2Y3(B) and CYP3A65(C). (D-F) Polydatin decreased mRNA levels of HMGCRa(D), HMGCRb(E), FASN(F). ∗P < 0.05 vs. control group; #P < 0.05 vs. ethanol group. |

Polydatin reduced oxidative stress and DNA damage in zebrafish larvae. (A) DHR 123 was used to detect ROS in the liver. The red channel in ethanol group is more bright contrast with control and treatment groups. (B-C) mRNA level of CHOP(B) and GADD45αa(C) suppressed in treatment group. ∗P < 0.05 vs. control group; #P < 0.05 vs. ethanol group. |