
- Title
-
Long-term in vivo single-cell lineage tracing of deep structures using three-photon activation.
- Authors
- Tekeli, I., Aujard, I., Trepat, X., Jullien, L., Raya, A., Zalvidea, D.
- Source
- Full text @ Light Sci Appl
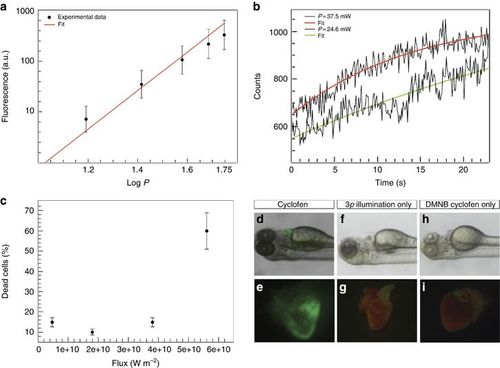
(a) Three-photon excitation fluorescence from blue fluospheres in suspension (slope of the linear fit, m=2.95) versus the input power at 1064 nm. (b) Three-photon uncaging of DMNB coumarin. Fluorescence increase observed upon illumination of a single cell using 24.6 (lower curve) and 37.5 mW (upper curve). (c) Percentage of dead cells as function of laser flux for illumination at 1064 nm. (d–i) Control experiments showing activated heart when the animal is exposed to cyclofen (d, e), non-activated heart when the animal was illuminated with the three-photon source but not treated with DMNB cyclofen (f, g) or when the animal was treated with DMNB cyclofen but not illuminated with the three-photon source (h, i). |
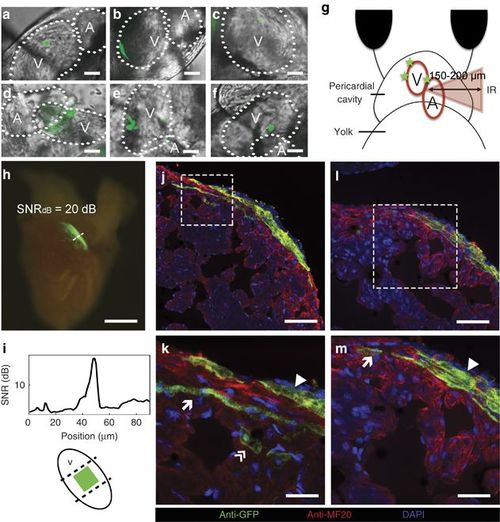
Long-term in vivo lineage tracing of zebrafish cardiomyocytes. (a–f) Selected areas labeled in the heart of the zebrafish embryo in order of accessibility (scale bar=10 μm, for more details see Materials and Methods): (a, b) approximately100 μm2-labeled areas; (c) a single cell of 100 μm2; (d–f) multiple labeled areas at different locations; and (g) a diagram depicting how areas behind inhomogeneous tissue were labeled at z~150–200 μm. (h) Excised heart of an adult zebrafish. The original ~100 μm2-labeled area was extended to ~0.125 mm2 (scale bar=250 μm); (i) a fluorescence SNR of ~20 dB and the position of the original labeled zone. (j–m) Immunostaining images of the adult zebrafish heart show the participation of the photoactivated cardiomyocytes in the three layers of the heart wall. Scale bars=50 μm (j); 5 μm (k); 20 μm (l); and 10 μm (m). DAPI, 4′,6-diamidino-2-phenylindole; SNR, signal-to-noise ratio. |
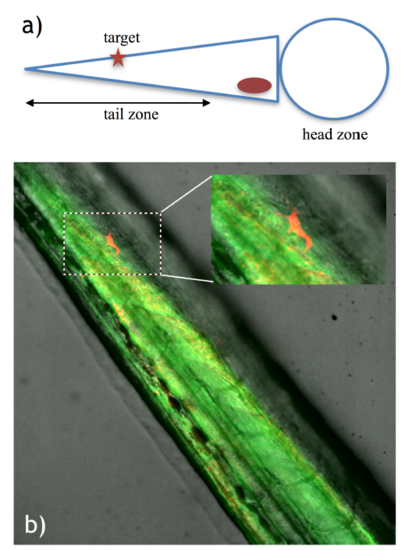
Single cell labeling in the zebrafish tail. a) Diagram depicting the embryo positioning for the experiment and the target area in the embryo tail. b) Labeled cell identified by red fluorescence (mCherry expression), demonstrating successful photoactivation in the zebrafish tail. The inset shows a magnification of the boxed area. |
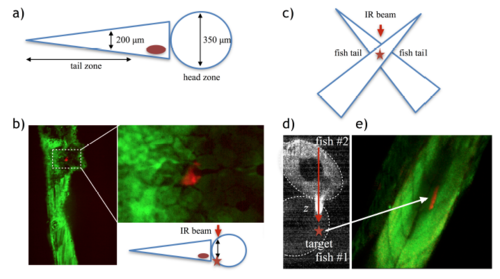
Exploring activation depth. a) Schematic of a 5-7 dpf zebrafish showing relative dimensions. b) Successful labeling (red fluorescence) in the head area after irradiating a patch of 50 μm2, which resulted in an activation area of 150 μm2 corresponding to a single cell and depth z ∼ 200 μm (the boxed area is magnified in the right image, scale bar = 20 μm). c-d) We also designed an experiment where we could irradiate through fish tissue in the tail zone, but deeper than 200 μm. We superposed two fish in a crossed position, as shown in the schematic (c), and irradiated the crossed area using this configuration. We could activate areas of 1600 μm2 passing through tissue length z ∼ 360 μm (d) (Scale bar = 80 μm). |