
Fig. 2
- ID
- ZDB-FIG-180927-52
- Publication
- Tekeli et al., 2016 - Long-term in vivo single-cell lineage tracing of deep structures using three-photon activation.
- Other Figures
- All Figure Page
- Back to All Figure Page
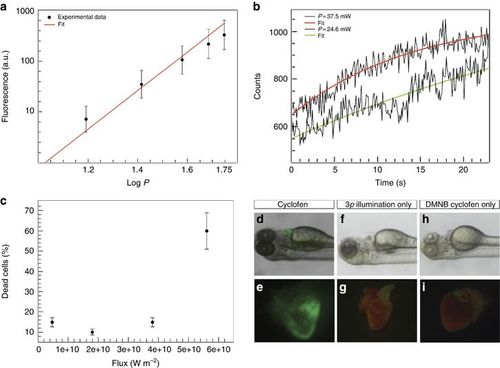
(a) Three-photon excitation fluorescence from blue fluospheres in suspension (slope of the linear fit, m=2.95) versus the input power at 1064 nm. (b) Three-photon uncaging of DMNB coumarin. Fluorescence increase observed upon illumination of a single cell using 24.6 (lower curve) and 37.5 mW (upper curve). (c) Percentage of dead cells as function of laser flux for illumination at 1064 nm. (d–i) Control experiments showing activated heart when the animal is exposed to cyclofen (d, e), non-activated heart when the animal was illuminated with the three-photon source but not treated with DMNB cyclofen (f, g) or when the animal was treated with DMNB cyclofen but not illuminated with the three-photon source (h, i). |