- Title
-
Mutations in dock1 disrupt early Schwann cell development
- Authors
- Cunningham, R.L., Herbert, A.L., Harty, B.L., Ackerman, S.D., Monk, K.R.
- Source
- Full text @ Neural Dev.
|
stl145 mutants exhibit decreased mbp expression in the PNS. a-d) Lateral views of mbp expression by WISH. Arrowheads indicate the PLLn. Asterisks indicate the central nervous system (CNS). Inset panels show a magnified view of the PLLn. Scale bars = 100 μm. a) mbp at 3 dpf is strongly expressed in the PLLn of control larva (n = 93/96). b) stl145 mutants at 3dpf exhibit reduced mbp expression in the PLLn (n = 34). c) mbp expression is strongly expressed in the PLLn of control larva at 5 dpf (n = 52/62). d) stl145 mutants at 5 dpf express mbp, but at reduced levels compared to control siblings (n = 27/30). e) Analysis of whole genome sequencing data showed that chromosome 12 exhibited the highest mutant to wild-type allele ratio. f) Within the most highly linked region of chromosome 12, dock1 was the only gene that contained an early stop codon. g) A schematic of the protein structure of Dock1 and the location of the stl145 lesion. The SH3 and proline rich domains can bind adaptor proteins. The DHR-1 domain interacts with PtdIns(3,4,5)P3 and the DHR-2 domain is the catalytic domain can that catalyzes the exchange of GDP for GTP in Rac1. h-i) Quantification of WISH for mbp at 3 dpf (h) and 5 dpf (i), respectively, based on phenotypic classes and genotypes for the stl145 lesion. **** p < 0.0001, Chi-squared analysis. j) Genotyping assay for the stl145 lesion. The PCR amplified product is digested with BstN1 and run on a 3% agarose gel EXPRESSION / LABELING:
PHENOTYPE:
|
|
Mutations in dock1 cause decreased mbp expression in the PNS. a-d) Lateral views of mbp expression by WISH at 3 dpf. Arrowheads indicate PLLn. Asterisks indicates the CNS. Inset panels show a magnified view of PLLn. Scale bars = 100 μm. a) Control larvae robustly express mbp in the PLLn (n = 29/38). b) dock1stl145 homozygous mutants exhibit strongly reduced mbp expression in the PLLn (n = 6/6). c) Control larvae injected with dock1 mRNA exhibit strong expression of mbp in the PLLn (n = 50/53). d) dock1stl145 homozygous mutants injected with dock1 mRNA robustly express mbp in the PLLn (n = 13/25). e) Quantification of the percent phenotypic classes larvae were scored for mbp expression in the PLLn at 3 dpf. Control = pooled uninjected and phenol red injected larvae. f) A schematic of the Dock1 protein with the locations of the stl366, stl365, and stl145 lesions indicated. g-j) Lateral views of mbp expression by WISH at 3 dpf. Arrowheads indicate the PLLn. Asterisks indicate the CNS. Inset panels show a magnified view of PLLn. Scale bars = 100 μm. g) dock1stl365 homozygous mutants (n = 20) and h) dock1stl366 homozygous mutants exhibit reduced mbp expression in the PLLn (n = 15/16). i) dock1stl145/stl365 compound heterozygotes and j) dock1stl145/stl366 compound heterozygotes exhibit reduced mbp expression in the PLLn. k, l) Quantification of WISH for mbp from dock1stl365 (k) and dock1stl366 (l) in-crosses based on phenotypic classes and genotypes for the respective lesions. * p < 0.05, *** p < 0.001, **** p < 0.0001, Chi-squared analysis EXPRESSION / LABELING:
PHENOTYPE:
|
|
PNS myelination is significantly reduced in stl145 mutants. a, b) TEM of a cross-section of the PLLn at 3 dpf. Myelinated axons are pseudocolored in green. Scale bars = 500 nm. a) Axons in wild-type PLLn begin to be myelinated while b) dock1stl145 homozygous mutant PLLn exhibits fewer myelination of axons. c) Quantification of the percent myelinated axons shows a significant difference between control (n = 6 animals, 10 nerves) and dock1stl145 mutants (n = 4 animals, 6 nerves). d) Quantification of the total number of axons (NS, p = 0.0983). e, f) Quantification of a cross-section of the PLLn at 5 dpf. Myelinated axons are pseudocolored in green. Scale bars = 500 nm. e) The PLLn of a wild-type larva contains numerous myelinated axons whereas f) a dock1stl145 homozygous mutant PLLn contains fewer myelinated axons. g) Quantification of the percent myelinated axons shows a significant difference between control (n = 11 animals, 18 nerves) and dock1stl145 mutants (n = 9 animals, 15 nerves). h) Quantification of the total number of axons (NS, p = 0.3031). Bars represent means ± SD. ***p < 0.001, ****p < 0.0001, unpaired t Test with Welch’s correction PHENOTYPE:
|
|
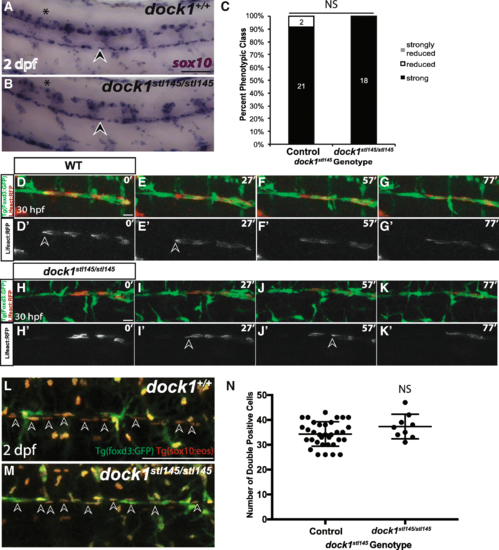
Schwann cell migration and number is not affected in stl145 mutants. a, b) Lateral view of WISH for sox10 at 2 dpf. Arrowheads indicate the PLLn. Asterisks indicate the CNS. a) Strongly expressing sox10 positive cells are located throughout the PLLn in control larvae (n = 21/23), similar to b) dock1stl145 homozygous mutant larva (n = 18). c) Quantification of WISH for sox10 at 2 dpf based on phenotypic classes and genotypes for the stl145 lesion shows no significant difference in expression (p = 0.3522, Bars represent means ± SD; Chi-squared analysis). d, g’) Still images from time-lapse imaging from 30 to 31.5 hpf in Tg(foxd3:gfp) wild-type larvae injected with sox10:Lifeact-RFP. Prime panels show Lifeact-RFP strongly localized at the back of migrating Schwann cells (arrowheads). Scale bars = 20 μm. h-k′) Still images from time-lapse imaging from 30 to 31.5 hpf in Tg(foxd3:gfp) dock1stl145/stl145 larvae injected with sox10:Lifeact-RFP. Prime panels show Lifeact-RFP strongly localized at the back of migrating Schwann cells (arrowheads). l, m) Lateral view of PLLn in 2 dpf larvae containing Tg(foxd3:gfp) and Tg(sox10(4.9):nls-eos). Arrows point to examples of double positive Schwann cells. Counting the number of Schwann cells double positive for GFP and RFP in l) control (n = 34) and m) dock1stl145 homozygous mutants (n = 9). Scale bars = 100 μm. n) Quantification of the number of Schwann cells within a defined region of the PLLn revealed no significant difference in Schwann cell number (NS, p = 0.1360). Bars represent means ± SD; unpaired t Test with Welch’s correction |
|
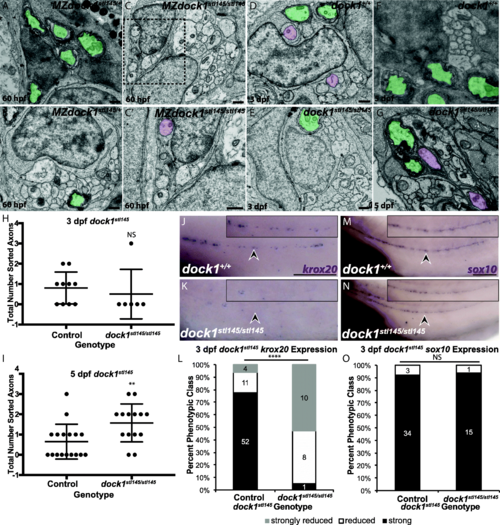
stl145 mutants exhibit delays in radial sorting and decreased expression of krox20. a-g) TEM of cross-sections of the PLLn. Myelinated axons are pseudocolored in green and axons associated with promyelinating Schwann cells are pseudocolored in purple. Scale bars = 500 nm. a, b) Micrographs from the same PLLn within a MZdock1stl145 heterozygote show Schwann cells myelinating axons at 60 hpf. C) An MZdock1stl145 homozygous larva does not have myelinated axons at 60 hpf, but Schwann cells are extending processes into axon bundles. C′) Magnification of inset from C shows an axon surrounded by a pro-myelinating Schwann cell. d, e) Schwann cells can myelinate and sort axons at 3 dpf in wild-type (n = 6 animals, 10 nerves) and mutant larvae (n = 4 animals, 6 nerves). f, g) More sorted axons are present in mutants (n = 8 animals, 15 nerves) at 5 dpf compared to controls (n = 11 animals, 17 nerves). Quantification of the number of sorted axons at h) 3 dpf and i) 5 dpf shows a statistical difference at 5 dpf (unpaired t Test with Welch’s correction). j, k) Lateral view of WISH for krox20 at 3 dpf. Arrowheads indicate PLLn. Inset panels show a magnified view of the PLLn. Scale bar = 50 μm. j) krox20 is expressed along the PLLn of control larvae (n = 67) whereas k) dock1stl145 homozygous mutants express little to no krox20 along the PLLn (n = 18/19). l) Quantification of WISH for krox20 at 3 dpf based on phenotypic classes and genotypes for the stl145 lesion (p < 0.0001, Chi-squared analysis). m, n) Lateral view of WISH for sox10 at 3 dpf. Arrowheads indicate the PLLn. Inset panels show a magnified view of the PLLn. Scale bar = 50 μm. m) Control larvae exhibit sox10 positive Schwann cells along the PLLn (n = 37) similar to N) dock1stl145 homozygous mutants (n = 16). o) Quantification of WISH for sox10 at 3 dpf based on phenotypic classes and genotypes for the stl145 lesion (p = 0.8141, Chi-squared analysis). Bars represent means ± SD, **p < 0.001, **** p < 0.0001 EXPRESSION / LABELING:
|
|
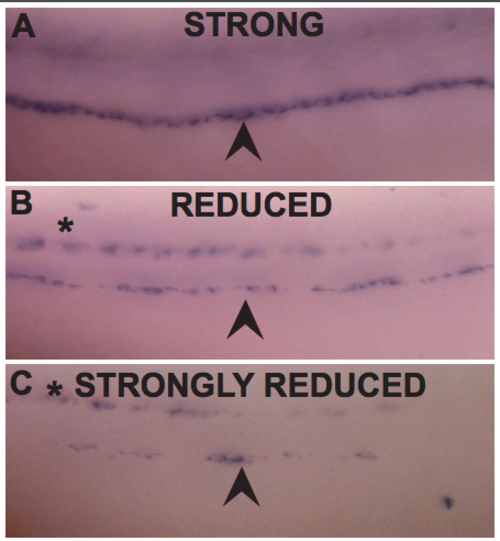
A-C) Lateral view of WISH for mbp. Arrowheads indicate the PLLn. Asterisks indicate the CNS. A) Representative image of a PLLn scored as “strong” expression, with mbp strongly and continuously expressed along PLLn B) as “reduced” expression, with reduced but consistent mbp expression along PLLn and C) as “strongly reduced” with patchy mbp expression along the PLLn. (PDF 846 kb) |
|
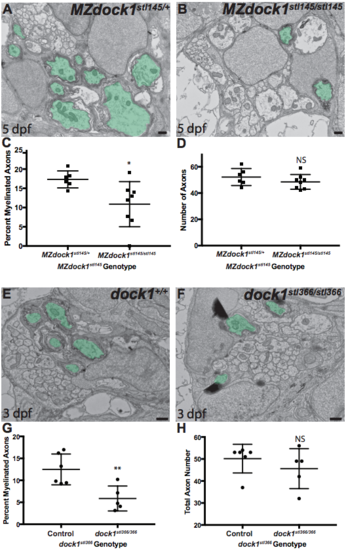
A-B) TEM of a cross-section of the PLLn at 5 dpf in MZ siblings. Myelinated axons are pseudocolored in green. Scale bars = 500 nm. A) Axons in MZdock1stl145 heterozygotes (n = 4 animals, 6 nerves) contain many myelinated axons whereas B) MZdock1stl145 mutants have fewer myelinated axons (n = 5 animals, 8 nerves). C) Quantification of the percent myelinated axons. D) Quantification of the total number of axons (NS, p = 0.2926). E-F) TEM of a cross-section of the PLLn at 3 dpf in dock1stl366 siblings. Myelinated axons are pseudocolored in green. Scale bars = 500 nm. E) Schwann cells in control siblings have myelinated more axons (n = 4 animals, 6 nerves) compared to F) dock1stl366 homozygous mutant nerves (n = 3 animals, 5 nerves). G) Quantification of the percent myelinated axons. H) Quantification of the total number of axons (NS, p = 0.3775). Bars represent means ± SD. *p < 0.05, **p < 0.01, unpaired t Test with Welch’s correction. (PDF 1677 kb) |
|
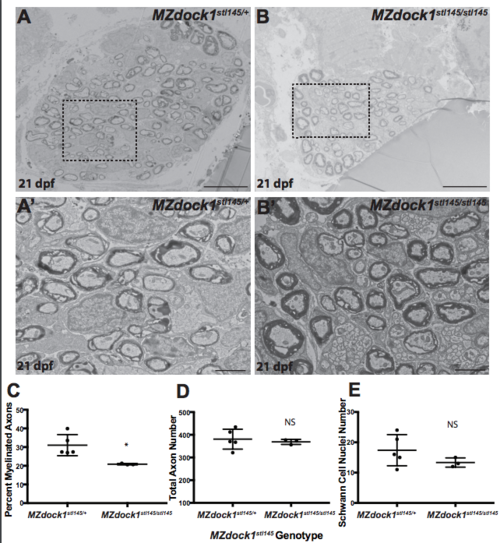
A-B) TEM of a cross-section of the PLLn at 21 dpf in MZ siblings. Scale bars = 10 μm. (A’-B′) Magnified images. Scale bars = 2 μm. A-A’) Axons in MZdock1stl145 heterozygotes (n = 4 animals, 5 nerves) contain many myelinated axons and B-B′) MZdock1stl145 mutants have fewer myelinated axons (n = 2 animals, 3 nerves). C) Quantification of the percent myelinated axons. D) Quantification of the total number of axons (NS, p = 0.5831). E) Quantification of the total number of Schwann cell nuclei (NS, p = 0.1583). Bars represent means ± SD. *p < 0.05, unpaired t Test with Welch’s correction. (PDF 2275 kb) |
|
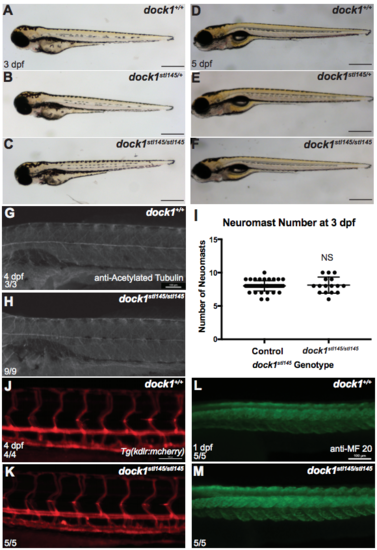
Gross development is normal at 3 dpf comparing A) wild-type, B) heterozygous, and C) mutant larvae from a dock1stl145 intercross. Scale bars = 500 μm. D-F) Gross development is normal and swim bladders have inflated at 5 dpf comparing D) wild-type, E) heterozygous, and F) mutant from a dock1stl145 intercross. Scale bars = 500 μm. G) Acetylated tubulin shows axons are present and well-fasiculated in both wild-type (n = 3) and H) dock1stl145/stl145 mutant larvae (n = 9) at 4 dpf. I) Neuromast number, detected by DASPEI labeling, did not vary between controls (n = 46) or mutants (n = 16) at 3 dpf (NS, p = 0.7518), indicating that global PLLn development is not affected. Bars represent means ± SD; unpaired t Test with Welch’s correction. J) Tg(kdlr:mcherry) labeling blood vessels at 4 dpf in wild-type and K) dock1stl14/stl145 mutants. L) MF 20 staining shows defined somite development in wild-type and M) dock1stl14/stl145 mutant larvae at 1 dpf. Scale bars = 100 μm. (PDF 5492 kb) |


