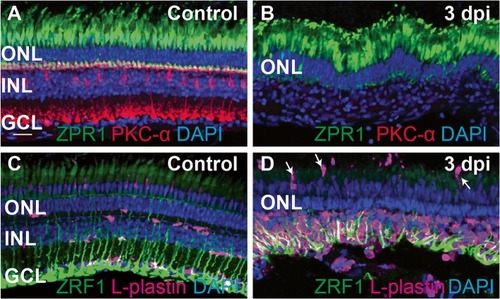
Ouabain-induced retinal degeneration results in a robust accumulation of responding immune cells. Images show cryosections from undamaged (control, A, C) and ouabain-damaged retinas at 3 days post-injection (3 dpi, B, D). A ZPR1 (green), PKC-α (Red), and DAPI (blue) were used to label cones of the outer retina, bipolar neurons of the inner retina, and all nuclei, respectively, in undamaged retinas. B Images of damaged retinas sampled at 3 dpi; inner retinal neurons have been destroyed (note the absence of PKC-α staining and absence of DAPI+ layer corresponding to the ganglion cell layer; GCL), but photoreceptors are spared (ZPR1, green). C Ramified microglia, labeled by L-plastin (magenta), are present in undamaged retinas, along with radially patterned Müller glia (ZRF1, green). D Müller glia (green) are spared from the ouabain-induced lesion. A large number of immune cells (magenta) responding to the lesion are present in the damaged retina, primarily localized to the region of neuronal cell death (inner retina), although some appear to be recruited from regions apical to the retina (arrows). DAPI+ nuclei in the inner retina visible in B can be identified as immune cells and Müller glia. Scale bar in A, applies to all images, = 20 μm. ONL = outer nuclear layer, INL = inner nuclear layer, GCL = ganglion cell layer

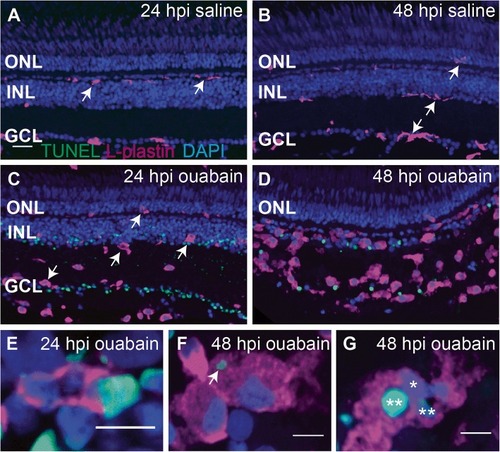
Progression of ouabain-induced retinal cell death and accumulation of immune cells in damaged retinas. Cryosections (5 μm thick) from retinas at 24 and 48 h post-intravitreal injection (24 and 48 hpi) of saline (A and B) or 2 μM ouabain (C and D) were stained using the TUNEL cell death detection process (green), the immune cell marker L-plastin (magenta), and DAPI (blue). AB Saline injection did not induce cell death (absence of TUNEL staining), and immune cells remain ramified (arrows). CD TUNEL+ nuclei and debris (green) are present in the ganglion cell layer (GCL) and inner nuclear layer (INL) following intravitreal injection of 2 μM ouabain, and immune cells assume ameboid morphologies (arrows). As the lesion progresses over time, immune cells accumulate in regions of cell death, and the clearance of TUNEL+ nuclei and debris corresponds to this immune cell accumulation. Few immune cells contained TUNEL+, DAPI+ nuclei (quantification in the “Results” section), suggesting that immune cell death was not significantly induced by ouabain. EG High magnification images of immune cells revealed immune cells phagocytosing TUNEL+ nuclei (E), immune cells with cytoplasmic TUNEL+ material (F, arrow), and immune cells with multiple nuclei, some of which are TUNEL+ (G, asterisks), suggesting that the accumulating immune cells are highly phagocytic and important for clearing dead cells and debris from the lesioned retina. Scale bar in A (applies to AD) = 20 μm. Scale bars in E, F, and G = 5 μm. ONL = outer nuclear layer, INL = inner nuclear layer, GCL = ganglion cell layer

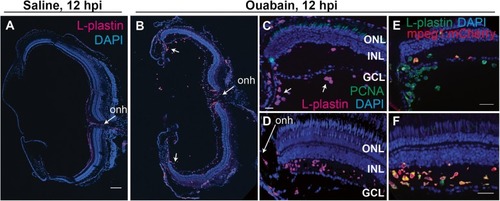
Evidence of early infiltration of immune cells to the retina at 12 h post-ouabain injection. Images of retinal cryosections at 12 h post-saline (A), or ouabain (BF) injection (12 hpi). A, B Show stitched images of entire cryosections stained for L-plastin (magenta) and DAPI (blue) obtained at × 20 magnification. Images in C and E show peripheral regions of retina. D, f Show central regions of retina adjacent to the optic nerve head (onh). Following ouabain injection, ameboid immune cells are seen in a gradient originating from the region of the optic nerve head (B, D, F), as well as vitreal to the ganglion cell layer in peripheral regions (C (arrows) and E). Cryosections were also stained for PCNA (green, C and D). PCNA expression was only rarely detected at this time point. E In peripheral retina, few L-plastin+ cells (green) co-label with mpeg1:mCherry transgene expression (red, co-labeled cells yellow). F In central retina, most L-plastin+ cells (green) co-label with mpeg1:mCherry transgene expression (red, co-labeled cells yellow). AD were obtained at × 20 magnification, E and F were obtained at × 40 magnification. Scale bar in (A) = 100 μm (applies to A and B); scale bar in C (applies to C and D) = 20 μm; scale bars in E and F = 20 μm

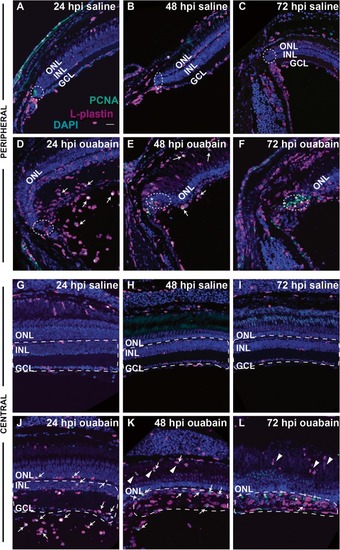
Distribution and proliferation markers in immune cells during the response to retinal damage. Images show staining of L-plastin (magenta), PCNA (green), and DAPI (blue) in cryosections of retinas injected with saline (AC and GI) or ouabain (EF and JL) at 24, 48, and 72 hpi. Images are from regions of peripheral retina (rows 1 and 2, AF) or central retina (rows 3 and 4, GL). PCNA+, L-plastin+ cells are indicated with white arrows, while PCNA+ non-immune cells are indicated with asterisks. In images of peripheral retina, regions corresponding to the ciliary marginal zone (CMZ) are within dotted ellipses. AC and GI Saline injection does not result in significant changes in L-plastin+ cell accumulation, location, or morphology and does not result in significant PCNA+ signal in L-plastin+ cells (AC and GI). DF and JL In ouabain-lesioned retinas, significant numbers of ameboid-shaped L-plastin+ cells are located in the region vitreal to the ganglion cell layer at 24 hpi and many are PCNA+ (D, J, arrows). At 48 hpi ouabain, L-plastin+ cells remain ameboid in shape, appear to accumulate at the region of the ouabain-induced lesion, and many are PCNA+ (E and K, arrows). By 72 hpi, PCNA+ signal is mainly localized to non-immune cells (asterisks*), although ameboid-shaped L-plastin+ cells remain in regions corresponding to the lesion (F and L). K, L Arrowheads indicate immune cells invading from regions posterior to the retina. GL Regions denoted with dotted white lines indicate regions (corresponding to the lesion) used for quantification of L-plastin+ cells shown in Fig. 4. Scale bar in A (applies to all images) = 20 μm. ONL = outer nuclear layer, INL = inner nuclear layer, GCL = ganglion cell layer

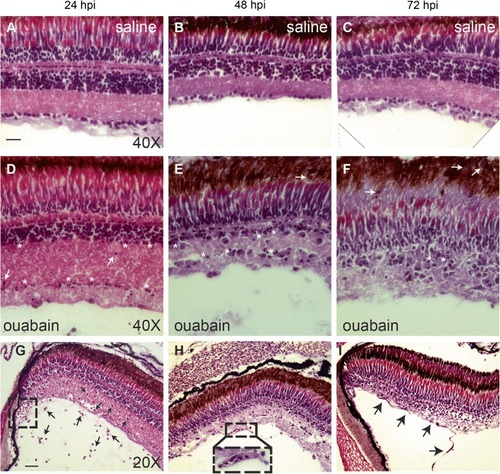
Progression of retinal degeneration and immune cell response visualized by Hematoxylin & Eosin (H&E). H&E staining of cryosections to visualize progression of the ouabain-induced lesion and immune cell accumulation. AC Saline-injected controls did not show significant changes in retinal structure; ramified microglia are not readily visualized due to their thin processes with little cytoplasm and integration into retinal layers. DF By 24 h post-ouabain injection (24 hpi), the inner retina has begun to swell, pyknotic nuclei are present (asterisks), and ameboid immune cells can be detected within the GCL and INL (D, white arrows and G, black arrows). Immune cells are visible in the vitreal space at 24 hpi (black arrows, G), consistent with invasion of extra-retinal immune cells from the retinal vitreal face. Immune cells accumulate in degenerating retinal tissue, which contains many pyknotic nuclei (asterisks), through 48 and 72 hpi ouabain injection (E and F). However, immune cells are no longer observed in the vitreal space at 48 and 72 hpi ouabain (E, F, H, I). Immune cells present in the degenerating retinal tissue are highly phagocytic, demonstrated by cytoplasmic color, regions of space immediately surrounding them, and the progressive disappearance of extracellular matrix and debris over time (D, E, F). Immune cells appear to invade from structures apical to the retina at 48 and 72 hpi ouabain (white arrows, E and F). GI Evidence of surviving blood vessels at all time points following ouabain injection: at 24 hpi, blood vessel structures at the anterior of the eye adjacent to the peripheral retina are present (dashed box, G). Sections of intact retinal blood vessels at the vitreal face of the retina are present at 48 and 72 hpi ouabain injection (dashed box and inset, H, and black arrows, I). Scale bar in A (applies to AF) = 20 μm. Scale bar in G (applies to GI) = 40 μm

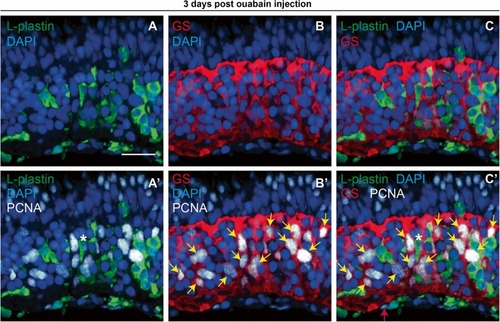
PCNA expression in immune cells and Müller glia at 72 h post-ouabain injection. Representative images of retinal cryosections at 72 h post-ouabain injection (72 hpi) stained for L-plastin to mark immune cells (green), glutamine synthetase to mark Müller glia (GS, red), PCNA (white), and DAPI (blue). A L-plastin and DAPI. B GS and DAPI. C L-plastin, GS, and DAPI. A’ L-plastin, PCNA, and DAPI. B’ GS, PCNA, and DAPI. C’ Four color merge of all stains. Nearly all PCNA+ nuclei can be attributed to immune cells or Müller glia at this time point. Asterisk (*) in A’ and C’ denotes L-plastin+, PCNA+ cell. Yellow arrows in B’ and C’ are provided to emphasize selected GS+ and PCNA+ cells. Occasionally, we observed PCNA+ nuclei at the vitreal surface at 3 dpi that could not be attributed to L-plastin+ or GS+ cells (C’, pink arrow). Scale bar in A (applies to all images) = 20 μm

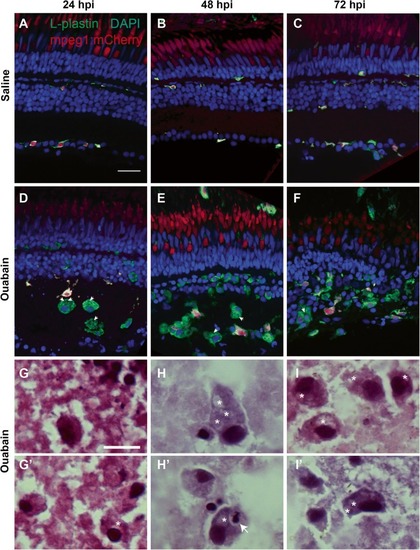
Immune cells responding to ouabain-induced retinal degeneration identify as macrophages. AF. Retinal cryosections from transgenic mpeg1:mCherry fish following intravitreal injection of saline (AC) or ouabain (DF) were immunolabeled with L-plastin (green) and counterstained with DAPI (blue). AC. In saline-injected controls, all L-plastin+ immune cells (green) co-label with the macrophage marker mpeg1:mCherry (red); co-label is yellow (AC), indicating ramified microglia. DF. Following ouabain injection, ameboid, L-plastin+ immune cells accumulate (green, DF), but only a subset of these also express the mpeg1:mCherry reporter (yellow, DF). Arrowheads indicate vacuoles in selected cells. GI High magnification images of retinal cryosections from ouabain damaged retinas stained with H&E reveal classical characteristics of phagocytic macrophages in accumulating immune cells (GI and G’I’), indicating that these accumulating immune cells are in fact macrophages. These features include irregular shapes of cell bodies and nuclei, cytoplasm similar in color to the environment, space immediately surrounding the cell borders, and the presence of vacuoles (asterisks). H’ Pyknotic nucleus within the cytoplasm of a macrophage (arrow), indicating phagocytosis of apoptotic cells. The red signal in the ONL in images AF is due to autofluorescence from photoreceptors. Scale bar in A (applies to AF) = 20 μm. Scale bar in G (applies to GI and G’I”) = 10 μm

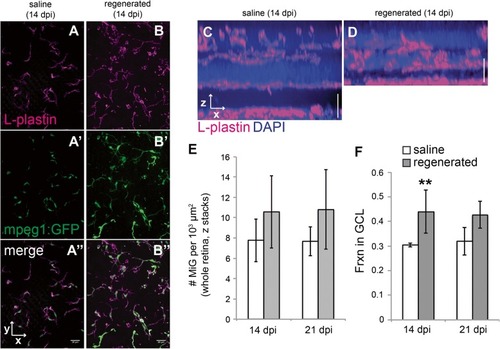
Microglia distribute to regions containing histologically regenerated retinal neurons. AB. Images (A and B) show z projections from saline injected (AA”) or regenerated (BB”) mpeg1:GFP (green) flat-mounted whole retinas labeled with L-plastin (magenta). By 14 dpi, all immune cells in the histologically regenerated retinas express the mpeg1:GFP reporter (BB”), and the marker L-plastin can be used to label these mpeg1:GFP+ immune cells. CD Resliced images from whole flat-mounted retinas labeled with L-plastin (magenta) are shown to demonstrate distribution of microglia in control (C) and histologically regenerated retinas at 14 dpi ouabain (D). E Densities of microglia in whole, flat mounted saline injected (n = 3) and histologically regenerated retinas (14 (n = 4) or 21 dpi (n = 3) ouabain). Densities were calculated by counting microglia in individual z stacks obtained from flat mounted retinas, which included retinal layers from the ganglion cell layer to the outer nuclear layer (representing approximately 50–80 μm of depth; Fig. 7A, B in their entirety show representative regions that were quantified). Counts were normalized to 1000 μm² (area) rather than volume because regenerated retinas are thinner than controls. This area represents x and y directions parallel to the layers of the flattened retina. F Fraction of microglia in the ganglion cell layer of saline injected (n = 3) and histologically regenerated retinas (14 (n = 4) or 21 dpi (n = 3) ouabain). **p = 0.048 (two-tailed Student’s t test comparing regenerated to saline injected at indicated time point), effect size 1.56. Error bars indicate standard deviation. Scale bar in A” (applies to AA” and BB”) = 20 μm. Vertical scale bar in C and D = 20 μm

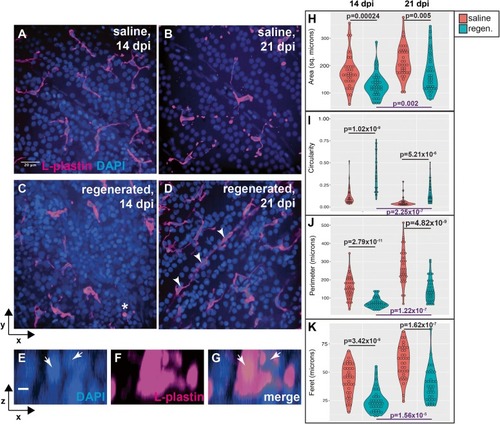
Morphological features of microglia in ganglion cell layer of histologically regenerated retinas. AD Images show L-plastin+ microglia (magenta) in the ganglion cell layer (GCL) of saline injected (A and B) or histologically regenerated retinas at 14 or 21 dpi ouabain (C and D). Microglia in saline injected retinas appear ramified, displaying long complex processes with multiple tips (A and B). Microglia in regenerated retinas at 14 dpi appear rounded (ameboid) in shape and have few processes (C). In regenerated retinas at 21 dpi, microglia remain more ameboid than those seen in saline injected controls; however, some microglia begin to display more cellular processes (D). Microglia in regenerated retinas are occasionally associated with multiple nuclei (asterisk, C, resliced projections EG). Chains of rod-shaped microglia are observed in regenerated retinas (D, arrowheads). EG Individual channels in resliced projections of the microglia denoted by a asterisk in (C). Arrows indicate DAPI+ nuclei. HK Violin plots show distributions of area (H), circularity (I), perimeter (J), and Feret diameter (K) of individually traced microglia located in the GCL at 14 and 21 dpi following injection of saline (red plots) or ouabain (regenerated, teal plots). Violin shapes show distribution of all measurements; circles within violin plots represent individual microglia. Area is reported in square microns; circularity as a value from 0 to 1.0 (1.0 indicating perfect circle); perimeter and Feret’s diameter are reported in microns. More information on morphological parameters/measurements is located in the “Methods” section. Indicated p values (two-tailed Student’s t test) in black compare measurements from regenerated to saline injected at the same time point; p values in purple (bottom of graphs) compare measurements from 21 to 14 dpi ouabain. Scale bar in A (applies to AD) = 20 μm; scale bar in E (applies to EG) = 5 μm

Acknowledgments
This image is the copyrighted work of the attributed author or publisher, and ZFIN has permission only to display this image to its users. Additional permissions should be obtained from the applicable author or publisher of the image. Full text @ J Neuroinflammation