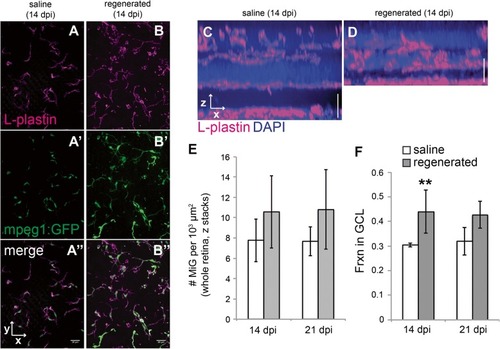
Microglia distribute to regions containing histologically regenerated retinal neurons. A–B. Images (A and B) show z projections from saline injected (A–A”) or regenerated (B–B”) mpeg1:GFP (green) flat-mounted whole retinas labeled with L-plastin (magenta). By 14 dpi, all immune cells in the histologically regenerated retinas express the mpeg1:GFP reporter (B–B”), and the marker L-plastin can be used to label these mpeg1:GFP+ immune cells. C–D Resliced images from whole flat-mounted retinas labeled with L-plastin (magenta) are shown to demonstrate distribution of microglia in control (C) and histologically regenerated retinas at 14 dpi ouabain (D). E Densities of microglia in whole, flat mounted saline injected (n = 3) and histologically regenerated retinas (14 (n = 4) or 21 dpi (n = 3) ouabain). Densities were calculated by counting microglia in individual z stacks obtained from flat mounted retinas, which included retinal layers from the ganglion cell layer to the outer nuclear layer (representing approximately 50–80 μm of depth; Fig. 7A, B in their entirety show representative regions that were quantified). Counts were normalized to 1000 μm² (area) rather than volume because regenerated retinas are thinner than controls. This area represents x and y directions parallel to the layers of the flattened retina. F Fraction of microglia in the ganglion cell layer of saline injected (n = 3) and histologically regenerated retinas (14 (n = 4) or 21 dpi (n = 3) ouabain). **p = 0.048 (two-tailed Student’s t test comparing regenerated to saline injected at indicated time point), effect size 1.56. Error bars indicate standard deviation. Scale bar in A” (applies to A–A” and B–B”) = 20 μm. Vertical scale bar in C and D = 20 μm
|
