IMAGE

Fig. 3

ID
ZDB-IMAGE-190723-1920
Source
Figures for Mitchell et al., 2018
Image
Figure Caption

Fig. 3

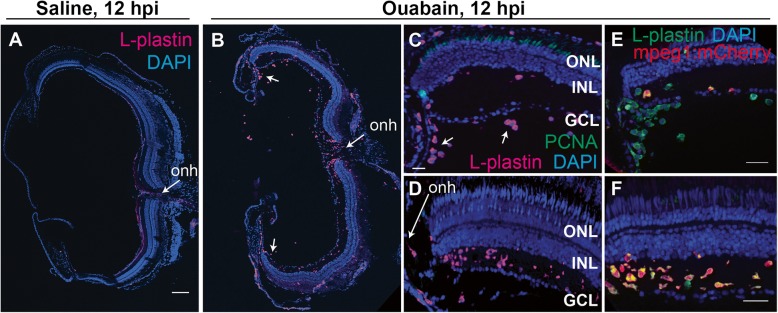
Evidence of early infiltration of immune cells to the retina at 12 h post-ouabain injection. Images of retinal cryosections at 12 h post-saline (A), or ouabain (BF) injection (12 hpi). A, B Show stitched images of entire cryosections stained for L-plastin (magenta) and DAPI (blue) obtained at × 20 magnification. Images in C and E show peripheral regions of retina. D, f Show central regions of retina adjacent to the optic nerve head (onh). Following ouabain injection, ameboid immune cells are seen in a gradient originating from the region of the optic nerve head (B, D, F), as well as vitreal to the ganglion cell layer in peripheral regions (C (arrows) and E). Cryosections were also stained for PCNA (green, C and D). PCNA expression was only rarely detected at this time point. E In peripheral retina, few L-plastin+ cells (green) co-label with mpeg1:mCherry transgene expression (red, co-labeled cells yellow). F In central retina, most L-plastin+ cells (green) co-label with mpeg1:mCherry transgene expression (red, co-labeled cells yellow). AD were obtained at × 20 magnification, E and F were obtained at × 40 magnification. Scale bar in (A) = 100 μm (applies to A and B); scale bar in C (applies to C and D) = 20 μm; scale bars in E and F = 20 μm

Acknowledgments
This image is the copyrighted work of the attributed author or publisher, and ZFIN has permission only to display this image to its users. Additional permissions should be obtained from the applicable author or publisher of the image. Full text @ J Neuroinflammation