IMAGE

Fig. 7

ID
ZDB-IMAGE-190723-1925
Source
Figures for Mitchell et al., 2018
Image
Figure Caption

Fig. 7

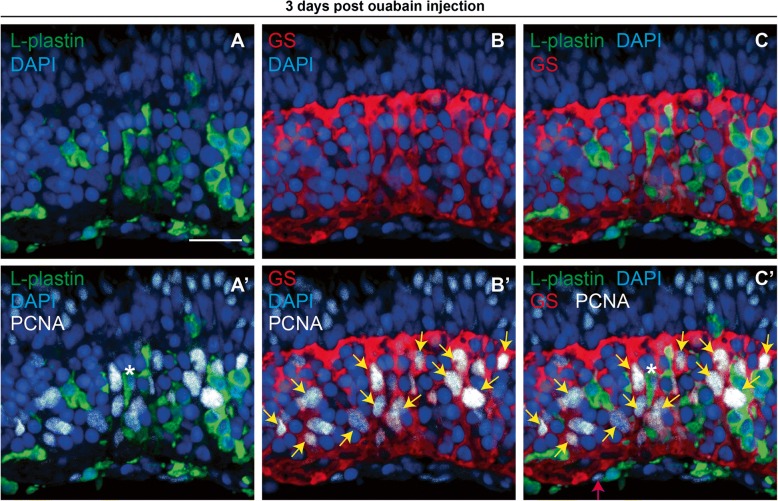
PCNA expression in immune cells and Müller glia at 72 h post-ouabain injection. Representative images of retinal cryosections at 72 h post-ouabain injection (72 hpi) stained for L-plastin to mark immune cells (green), glutamine synthetase to mark Müller glia (GS, red), PCNA (white), and DAPI (blue). A L-plastin and DAPI. B GS and DAPI. C L-plastin, GS, and DAPI. A’ L-plastin, PCNA, and DAPI. B’ GS, PCNA, and DAPI. C’ Four color merge of all stains. Nearly all PCNA+ nuclei can be attributed to immune cells or Müller glia at this time point. Asterisk (*) in A’ and C’ denotes L-plastin+, PCNA+ cell. Yellow arrows in B’ and C’ are provided to emphasize selected GS+ and PCNA+ cells. Occasionally, we observed PCNA+ nuclei at the vitreal surface at 3 dpi that could not be attributed to L-plastin+ or GS+ cells (C’, pink arrow). Scale bar in A (applies to all images) = 20 μm

Acknowledgments
This image is the copyrighted work of the attributed author or publisher, and ZFIN has permission only to display this image to its users. Additional permissions should be obtained from the applicable author or publisher of the image. Full text @ J Neuroinflammation