
- Title
-
The Primodos components Norethisterone acetate and Ethinyl estradiol induce developmental abnormalities in zebrafish embryos
- Authors
- Brown, S., Fraga, L.R., Cameron, G., Erskine, L., Vargesson, N.
- Source
- Full text @ Sci. Rep.
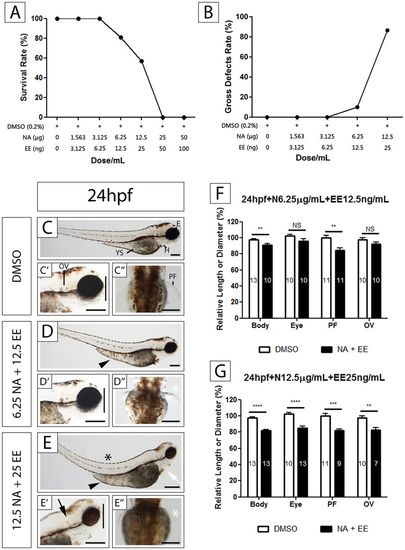
Effects of exposure to the NA/EE Mixture upon Survival and Development of Zebrafish Embryos Are Time and Dose Sensitive Zebrafish embryos at 24 hpf were treated with either DMSO, NA 6.25 μg/mL + EE 12.5 ng/mL or NA 12.5 μg/mL + EE 25 ng/mL, incubated until 96 hpf and overall body size, PF, OV and eye size measured. (A) The survival rate decreases as the dose increases. Survival rate starts to decrease at a concentration of NA 6.25 µg/mL + EE 12.5 ng/mL. (B) The rate of gross defects occurrence increases as the dose increases. Embryos start to present defects at a concentration of NA 6.25 µg/mL + EE 12.5 ng/mL (C–G) NA and EE mixture causes reduction of body size, PF, OV and eye size in a dose-dependent manner. Damage caused by the drugs is less severe in embryos treated with lower dose (D–D”) when compared to DMSO controls (C–C” and F). NA: Norethisterone acetate. EE: Ethinyl Estradiol. H: heart; YS: yolk sac; OV: otic vesicle; PF: pectoral fin. Black arrowhead indicates yolk sac and extension oedema. Black arrow indicates otic vesicle is smaller. Black asterisk denotes bent spine. White asterisk denotes reduced (D”) or missing pectoral fin (E”). White arrow indicates pericardial oedema. Vertical black line compares the eye diameter between NA/EE-mixture and DMSO treated embryos in C’, D’ and E’, and indicates diameter of the eye is altered in NA/EE-treated embryos. Relative length: compared to WT. Statistical significance was analysed using Student t-test. Graphs represent mean ± SEM. **p < 0.01, ***p < 0.001 and ****p < 0.0001. Scale bars: 250 µm. |
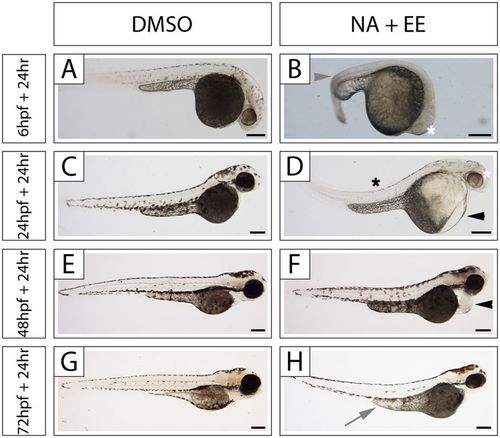
The NA/EE-mixture induces morphological damage in zebrafish embryos at 6 hpf, 24 hpf, 48 hpf and 72 hpf in a stage-sensitive manner. Embryos at 6 hpf, 24 hpf, 48 hpf and 72 hpf were treated with either DMSO or NA/EE-mixture (NA 12.5 μg/mL + EE 25 ng/mL), incubated for 24 hours then fixed and imaged. (A–H) Embryos at 6 hpf (A,B), 24 hpf (C,D), 48 hpf (E, F), 72 hpf (G,H) treated with DMSO (A,C,E,G) or NA/EE-mixture (B,D,F,H; n > 15 for all time points and conditions). Note: twisted spine (grey arrowhead); smaller eye (white asterisk); yolk sac anomalies/oedema (grey arrow), bent spine (black asterisk) and pericardial defect (black arrowhead). Scale bars: 250 µm. |
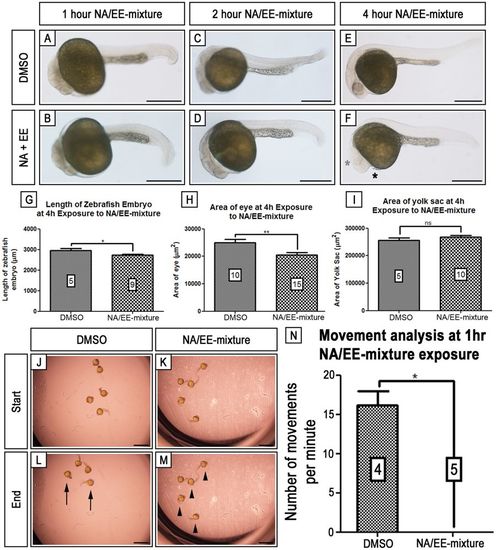
3 Embryonic damage is seen within 4 hrs of NA/EE-mixture exposure and embryonic movement is stunted from 1 hr of exposure. Zebrafish embryos at 24 hpf were treated with either DMSO (A,C,E) or NA/EE-mixture (B,D,F) for 1 hr (A,B), 2 hr (C,D) or 4 hr (E,F) before fixation. Overall body length, eye area and yolk sac area were measured. Embryos begin to show heart defects (n = 2/5) (black asterisk) and smaller body length (G) and eye area and pigment (H) (grey asterisk) by 4 hr exposure. At 4 hr, there is no change in the area of the yolk sac between DMSO control and NA/EE-mixture treated embryos (I). At 1 hr exposure, it was noted that there was a drastic decrease in movement in NA/EE-mixture treated embryos. This was determined using time lapse recording of embryos for 2 minutes and counting the number of times each embryo moved. The lack of movement can be visualised by comparing the starting and finishing positions of the embryos (J–M). In the DMSO treated well, there has been clear movement between 0 min (J) and 2 min (L), with one embryo having moved out of frame. Black arrows denote embryos in different positions. In comparison, the NA/EE-mixture treated embryos can be observed to have remained in the same position between 0 min (K) and 2 min (M). Black arrowheads show embryos in same position. The average number of movements recorded for DMSO treated embryos was 16 per minute compared to the average 0 per minute in the NA/EE-mixture treated embryos (N). |
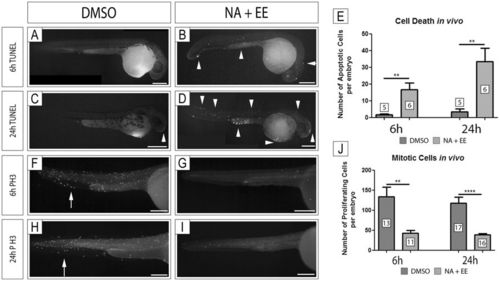
Cell Death is increased and Cell Proliferation decreased in Zebrafish Embryos Treated with NA/EE-mixture Zebrafish embryos at 24 hpf were treated with either DMSO or NA/EE-mixture and fixed at 6 hrs or 24 hrs post-treatment. Cell death and cell proliferation analyses were assessed by TUNEL assay (A–D) or antibody staining with anti-Phosphohistone H3 (F–I), respectively. The number of apoptotic cells or cell undergoing mitosis were counted and compared between drug treated and DMSO controls. Proliferating cells were counted from the position of the yolk sac to the tail, not including the yolk sac or yolk extension. (A–E) Embryos treated with NA/EE-mixture present a higher number of apoptotic cells at 6 hours (A,B and E) and 24 hours (C–E). Apoptotic cells do not occur in specific regions of the embryos. White arrowheads denote examples of apoptotic cells, which outnumber those (if any) seen in DMSO controls. (F–J) Embryos treated with NA/EE-mixture present a significantly lower number of proliferating cells at 6 hours (F,G and J) and 24 hours (H–J). Proliferating cells are reduced in all regions of the embryos. White arrows indicate regions of proliferating cells, markedly reduced in treated embryos. Statistical significance was analysed using unpaired t test. Graphs represent mean ± SEM. **p < 0.01, ****p < 0.0001. Scale bars: 250 µm. |
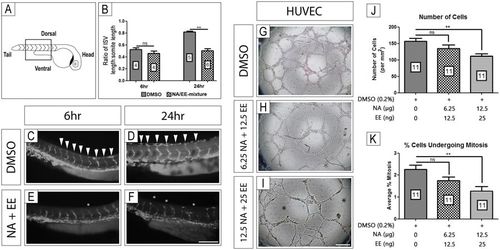
NA/EE-mixture exposure in vivo and in vitro causes vessel formation anomalies The effect of NA/EE-mixture on blood vessels was assessed by using zebrafish fli1:EGFP line and HUVEC culture. (A–F) In vivo growth of intersomitic blood vessels (highlighted by box in panel A) and patterning were analysed following treatment with either DMSO or NA/EE-mixture (NA 12.5 μg/mL and EE 25 ng/mL) for 6 or 24 hrs following treatment. (B) Ratio of intersomitic vessel length (ISV) to somite length 6 hrs and 24 hrs after treatment with DMSO (vehicle control) or NA/EE-mixture at 24 hpf. Statistical significance was analysed by Mann-Whitney test. (C,D) DMSO controls presented normal blood vessel growth and patterning when compared with untreated embryos (data not shown)41. (E,F) NA/EE-mixture treated embryos presented changes in growth and patterning of intersomitic vessels. (G–I) NA/EE-mixture disrupts the tube formation in HUVEC cultures in a dose-sensitive manner. (J,K) NA/EE-mixture reduces cell number and cell proliferation in a dose-sensitive manner in HUVEC cultures. Statistical significance was analysed using One-way ANOVA followed by Tukey’s test. Graphs represent mean ± SEM. **p < 0.01. Scale bar E: 100 µm; scale bar H: 500 µm. White arrowheads denote normal position and pattern of Intersomitic vessels. White asterisks indicate examples of misposition and mispatterning of vessels, including vessel fusions. Black asterisk denote avascular and poorly patterned areas of treated HUVEC cultures. |
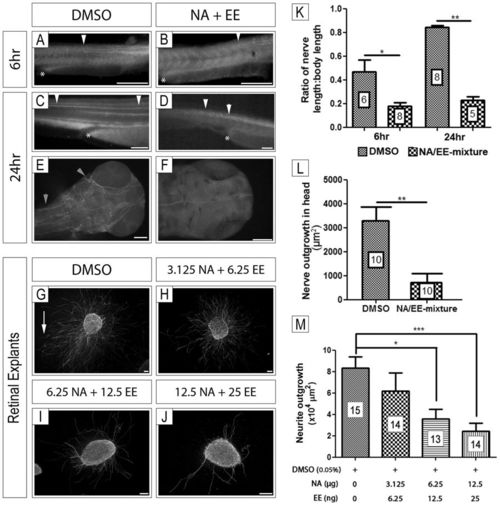
In vivo and in vitro neuro-inhibitory effects of NA/EE-mixture exposure NA/EE-mixture effects on zebrafish nerve outgrowth and patterning. Embryos were treated at 24 hpf with either DMSO (A,C and E) or NA/EE-mixture (B,D and F) and fixed at 6 hours and 24 hours. Embryos incubated with DMSO present normal nerve outgrowth and patterning. Compared to DMSO controls, embryos treated with NA/EE-mixture presented fasciculation defects. White asterisk denotes end of yolk sac. White arrowheads denote position of major nerve tract in spinal cord; at 24 hr nerve tract is stunted and defasciculated in treated embryos, compare arrowheads in C and D. Nerves are missing in the head of treated embryos (F) compared with control embryos, grey arrowhead denotes axon projections (E). Direct effect of NA/EE-mixture on nerves was assessed through retinal explants culture exposed to DMSO and NA/EE-mixture over different concentrations; 0.05% DMSO (G), NA 3.125 μg/mL + EE 6.25 ng/mL (H), NA 6.25 μg/mL + EE 12.5 ng/mL (I) and NA 12.5 μg/mL + EE 25 ng/mL (J) treatment. (K) Ratio of nerve length to body length is reduced in treated embryos at 6 hpf and 24 hpf as is the ratio of nerve outgrowth (L) in the head following treatment at 24 hpf. Statistical significance was analysed through Mann-Whitney test. (M) Neurite outgrowth in retinal explants was decreased significantly following NA/EE-mixture exposure at NA 6.25 μg/mL + EE 12.5 ng/mL (H and M) and NA 12.5 μg/mL + EE 25 ng/mL (J and M). White arrow denotes an example of an axon projection. Statistical significance was analysed using Kruskal-Wallis test with Dunn’s post-hoc test. Graphs represent mean ± S.E.M. ns, p > 0.05; *p < 0.05; ***p < 0.001. Scale bars: 100 µm. |