
|
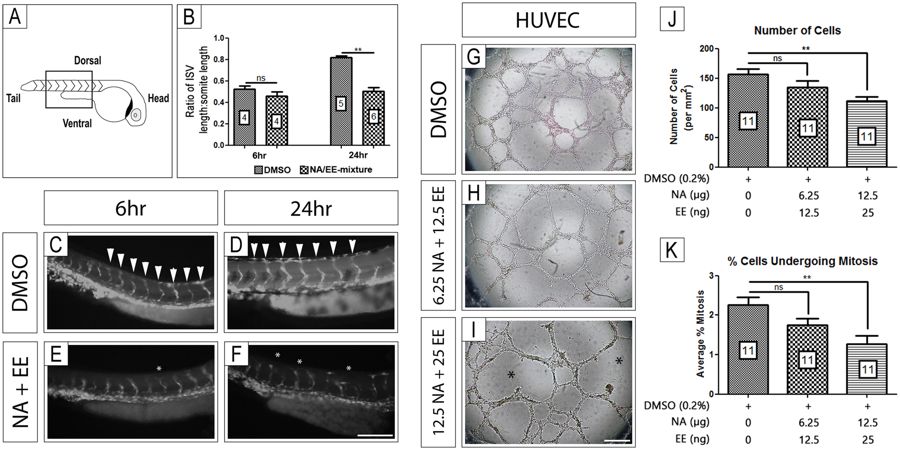
Fig. 6
NA/EE-mixture exposure in vivo and in vitro causes vessel formation anomalies The effect of NA/EE-mixture on blood vessels was assessed by using zebrafish fli1:EGFP line and HUVEC culture. (A–F) In vivo growth of intersomitic blood vessels (highlighted by box in panel A) and patterning were analysed following treatment with either DMSO or NA/EE-mixture (NA 12.5 μg/mL and EE 25 ng/mL) for 6 or 24 hrs following treatment. (B) Ratio of intersomitic vessel length (ISV) to somite length 6 hrs and 24 hrs after treatment with DMSO (vehicle control) or NA/EE-mixture at 24 hpf. Statistical significance was analysed by Mann-Whitney test. (C,D) DMSO controls presented normal blood vessel growth and patterning when compared with untreated embryos (data not shown)41. (E,F) NA/EE-mixture treated embryos presented changes in growth and patterning of intersomitic vessels. (G–I) NA/EE-mixture disrupts the tube formation in HUVEC cultures in a dose-sensitive manner. (J,K) NA/EE-mixture reduces cell number and cell proliferation in a dose-sensitive manner in HUVEC cultures. Statistical significance was analysed using One-way ANOVA followed by Tukey’s test. Graphs represent mean ± SEM. **p < 0.01. Scale bar E: 100 µm; scale bar H: 500 µm. White arrowheads denote normal position and pattern of Intersomitic vessels. White asterisks indicate examples of misposition and mispatterning of vessels, including vessel fusions. Black asterisk denote avascular and poorly patterned areas of treated HUVEC cultures.