
|
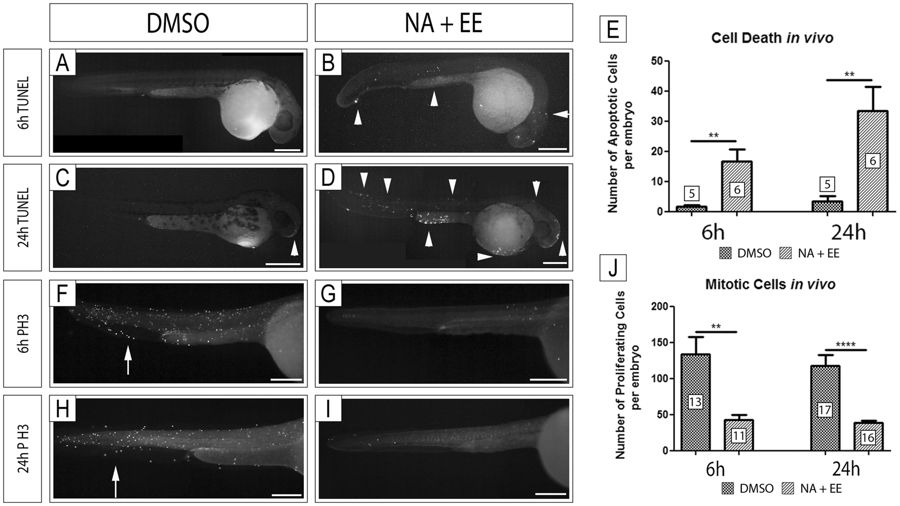
Fig. 5
Cell Death is increased and Cell Proliferation decreased in Zebrafish Embryos Treated with NA/EE-mixture Zebrafish embryos at 24 hpf were treated with either DMSO or NA/EE-mixture and fixed at 6 hrs or 24 hrs post-treatment. Cell death and cell proliferation analyses were assessed by TUNEL assay (A–D) or antibody staining with anti-Phosphohistone H3 (F–I), respectively. The number of apoptotic cells or cell undergoing mitosis were counted and compared between drug treated and DMSO controls. Proliferating cells were counted from the position of the yolk sac to the tail, not including the yolk sac or yolk extension. (A–E) Embryos treated with NA/EE-mixture present a higher number of apoptotic cells at 6 hours (A,B and E) and 24 hours (C–E). Apoptotic cells do not occur in specific regions of the embryos. White arrowheads denote examples of apoptotic cells, which outnumber those (if any) seen in DMSO controls. (F–J) Embryos treated with NA/EE-mixture present a significantly lower number of proliferating cells at 6 hours (F,G and J) and 24 hours (H–J). Proliferating cells are reduced in all regions of the embryos. White arrows indicate regions of proliferating cells, markedly reduced in treated embryos. Statistical significance was analysed using unpaired t test. Graphs represent mean ± SEM. **p < 0.01, ****p < 0.0001. Scale bars: 250 µm.