
- Title
-
Functional in vivo imaging using fluorescence lifetime light-sheet microscopy
- Authors
- Mitchell, C.A., Poland, S.P., Seyforth, J., Nedbal, J., Gelot, T., Huq, T., Holst, G., Knight, R.D., Ameer-Beg, S.M.
- Source
- Full text @ Opt. Lett.

FL-DSLM imaging of 5 dpf NFKB:EGFP zebrafish larvae. The camera exposure time was 1 s with 1 μm slice resolution. Extended orthogonal maximum projections (10 μm) of (A) the intensity and (B) the lifetime (both have a gamma correction of 0.5 applied) highlight the change in lifetime between the GFP muscle and FITC vasculature, despite the only small variation in color. The white lines denote the center of the displayed projections. (C) Absorption (dashed line) and emission (solid line) spectra of EGFP (black) and FITC (gray). (D) Segmented volume outlining the FITC-labelled vasculature, the dorsal aorta (DA) and intersegmental vessels (Se) can be clearly identified. The scale bar is 50 μm. |
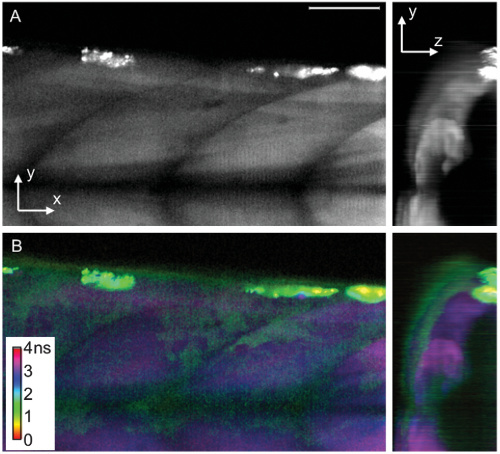
FL-DSLM volume of α-actin:GFP zebrafish muscle collected with 200 ms exposure at 1 μm intervals. Maximum intensity projections of stack in the xy (left) and yz (right) planes for (A) the intensity and (B) the lifetime. The short lifetime of the autofluorescence on the skin can be distinguished from the long lifetime GFP (purple) expressed in the muscle. Green intensity has been artificially brightened slightly to highlight the thin skin layer against the bright EGFP signal. The scale bar is 50 μm. |