
FIGURE
Fig. 4
- ID
- ZDB-FIG-170509-28
- Publication
- Mitchell et al., 2017 - Functional in vivo imaging using fluorescence lifetime light-sheet microscopy
- Other Figures
- All Figure Page
- Back to All Figure Page
Fig. 4
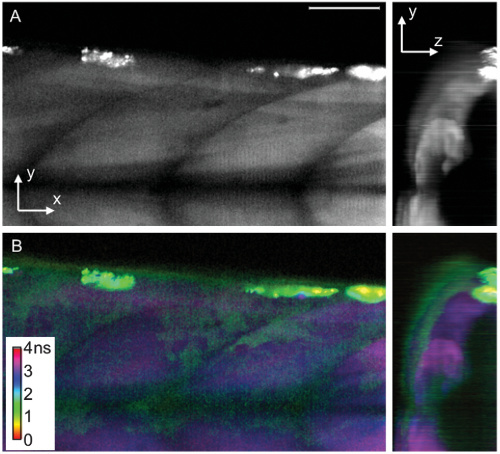
FL-DSLM volume of α-actin:GFP zebrafish muscle collected with 200 ms exposure at 1 μm intervals. Maximum intensity projections of stack in the xy (left) and yz (right) planes for (A) the intensity and (B) the lifetime. The short lifetime of the autofluorescence on the skin can be distinguished from the long lifetime GFP (purple) expressed in the muscle. Green intensity has been artificially brightened slightly to highlight the thin skin layer against the bright EGFP signal. The scale bar is 50 μm. |
Expression Data
Expression Detail
Antibody Labeling
Phenotype Data
Phenotype Detail
Acknowledgments
This image is the copyrighted work of the attributed author or publisher, and
ZFIN has permission only to display this image to its users.
Additional permissions should be obtained from the applicable author or publisher of the image.
Full text @ Opt. Lett.