
- Title
-
AIBP Limits Angiogenesis Through γ-Secretase-Mediated Upregulation of Notch Signaling
- Authors
- Meng, S., Mao, R., Gu, Q., Araujo-Gutierrez, R., Kumar, S., Yan, Q., Almazan, F., Youker, K.A., Fu, Y., Pownall, H.J., Cooke, J.P., Miller, Y.I., Fang, L.
- Source
- Full text @ Circ. Res.
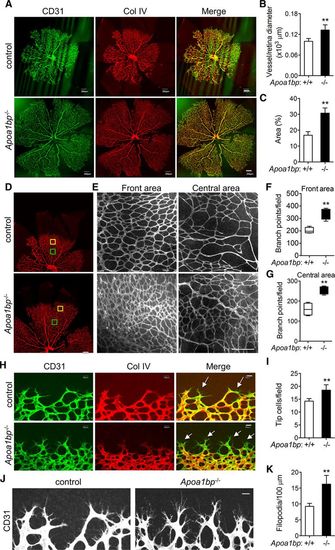
Retinal angiogenesis in Apoa1bp knockout mice. Retinas were isolated from postnatal day 5 (P5) Apoa1bp−/− mice and their control littermates and whole mount immunostaining performed for CD31 (cluster of differentiation 31 protein; green) and Collagen (Col) IV (red). Confocal images of retinas (A) and the quantification of vessel and retina diameter (B) and vessel area (C). D, The front and central areas of retinas analyzed are outlined in yellow and green. E, Enlarged areas of yellow and green squares in D. Quantification of branch points in the front (F) and the central areas (G). H and I, Tip cells and the quantification. Arrows show tip cells. J and K, Filopodia extension and the quantification. Mean±SD; n=3. **P<0.01. Scale bar: A, D, and E: 200 μm; H and J: 20 μm. |

Rescue effect of increased high-density lipoprotein (HDL) levels on angiogenesis and Notch signaling in AIBP (apolipoprotein A-I (apoA-I)–binding protein) null retinas. Retinas were isolated from Apoa1bp−/−Apoa1Tg and control Apoa1bp−/− mice at postnatal day 5 (P5), and whole-mount immunostaining of CD31 (cluster of differentiation 31 protein; green) and Col IV (red) was performed. A, Confocal images of retinas. Quantification of vessel and retina diameter (B) and vessel area (C). Retinal vasculature (D) and the quantification of branch points in the front areas (E) and central areas (F). G and H, Tip cells and the quantification. I and J, Filopodia extension and the quantification. K, Notch intracellular domain (NICD), phospho-VEGFR2 (vascular endothelial growth factor receptor-2; pVEGFR2), and total VEGFR2 protein levels in P5 retinas from Apoa1bp−/−Apoa1Tg and control Apoa1bp−/− mice. L, Quantification of NICD protein levels in K. M, Quantitative real-time polymerase chain reaction (RT-PCR) analysis of the Notch downstream Hey1, Hey1, and Hes2 gene expression in the retinas from Apoa1bp−/−Apoa1Tg and Apoa1bp−/− mice at P5. Mean±SD, n=3; *P<0.05; **P<0.01. Scale bar: A and D: 200 μm; G and I: 20 μm. |
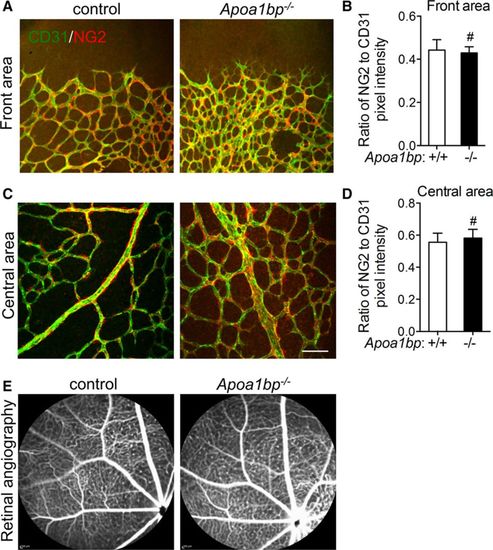
Vascular integrity in Apoa1bp−/− mice. Immunostaining of CD31 (cluster of differentiation 31 protein; green) and NG2 (red) in the front areas (A and B) and the central area (C and D) of the retinas from postnatal day 5 (P5) Apoa1bp−/− neonatal mice or their control littermates and the quantification results of NG2 fluorescence intensity (B and D). E, Representative fluorescein angiography images of 10-month Apoa1bp−/− and wild-type (WT) littermates (n=5 for AIBP [apolipoprotein A-I [apoA-I]–binding protein] knockout (KO) and n=3 for WT control). For A–D, Mean±SD; n=3. Scale bar: 100 μm. #not significant. |

AIBP (apolipoprotein A-I [apoA-I]–binding protein) effect on neovessel formation in subcutaneously implanted Matrigel plugs. A, Images of Matrigel plugs retrieved from Apoa1bp−/− or control mice. Matrigel plugs were paraformaldehyde (PFA)-fixed, sectioned, and subjected to hematoxylin and eosin (H&E) staining (B) and CD31 (cluster of differentiation 31 protein) immunohistochemistry (C). Note that substantial amount of red blood cells were present in the Matrigel plugs from Apoa1bp−/− mice. D and E, Quantitative real-time polymerase chain reaction (RT-PCR) analysis of endothelial cell (EC) gene markers CD31 and VE (vascular endothelial)-cadherin (VE-Cad). Western blot of Notch intracellular domain (NICD) expression (F), quantification of NICD protein levels in F (G), and qRT-PCR analysis of the Notch downstream gene expression (H) in the Matrigel plugs from Apoa1bp−/− or control mice. Mean±SD; n=4, *P<0.05; **P<0.01. Scale bar: B, 50 μm; C, 100 μm. |
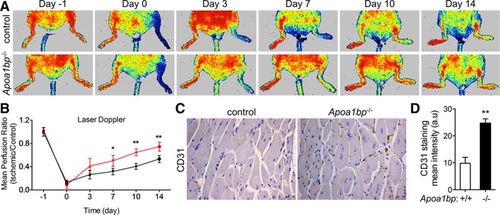
Laser Doppler Blood Perfusion (LDBP) imaging of control and AIBP (apolipoprotein A-I [apoA-I]–binding protein) knockout (KO) mice. A, Mice were subjected to hindlimb ischemia, and representative Laser Doppler images were shown at the indicated time points. Arrows point to the ischemic limbs. B, Quantitative assessment of limb perfusion. The results from AIBP KO mice are shown in red. C, Immunohistochemistry (IHC) analysis of CD31 (cluster of differentiation 31 protein) staining in the ischemic tissue from control or AIBP KO mice. D, Quantification of CD31 staining in C. Scale bar: 50 μm. Mean±SE; n=8 in each group, *P<0.05; **P<0.01. The statistical analysis was done using 1-way analysis of variance (ANOVA). |

AIBP (apolipoprotein A-I [apoA-I]–binding protein) expression in myocardial tissue from normal subjects or those with ischemic cardiomyopathy (ICM). A, Human normal and ICM tissues were stained with AIBP antibody or control IgG and further with a counterstain of the nuclei to visualize the myocardium. B, The quantified data were shown on the right. Scale bar: 50 μm. **P<0.01. |