
|
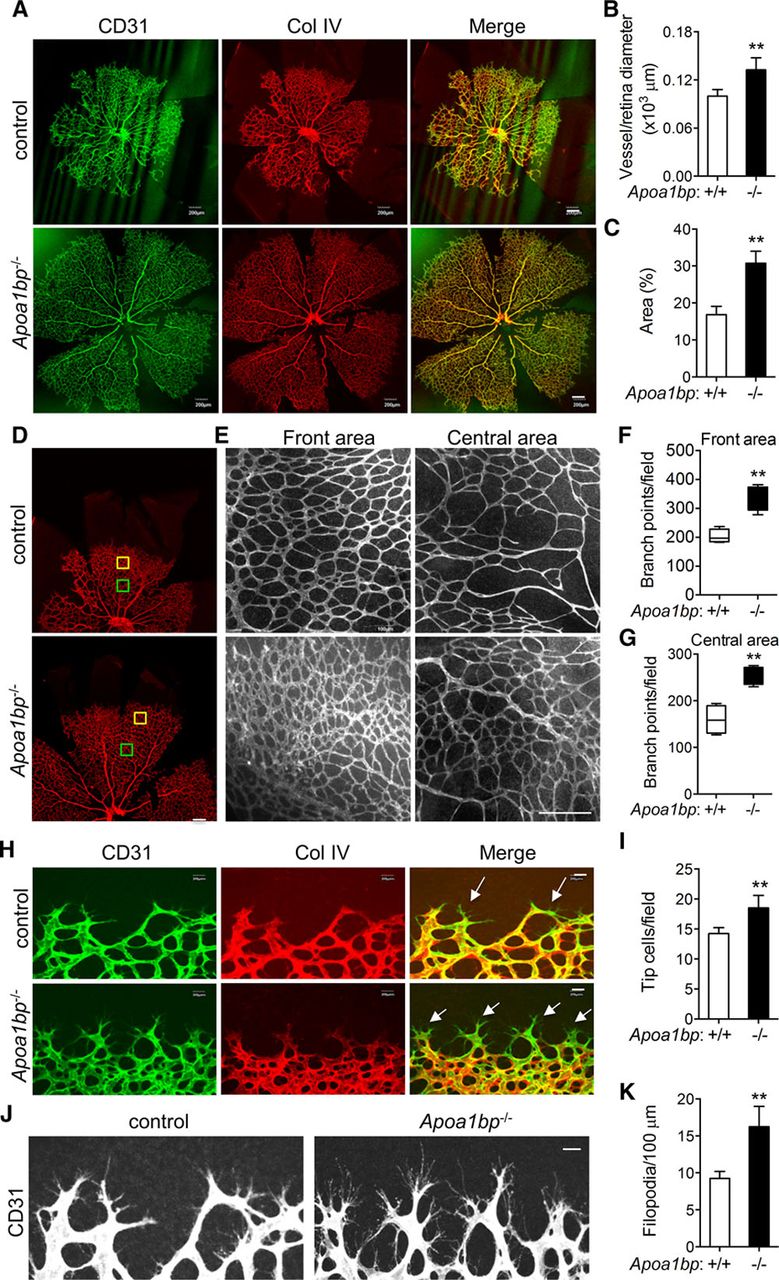
Fig. 1 Retinal angiogenesis in Apoa1bp knockout mice. Retinas were isolated from postnatal day 5 (P5) Apoa1bp−/− mice and their control littermates and whole mount immunostaining performed for CD31 (cluster of differentiation 31 protein; green) and Collagen (Col) IV (red). Confocal images of retinas (A) and the quantification of vessel and retina diameter (B) and vessel area (C). D, The front and central areas of retinas analyzed are outlined in yellow and green. E, Enlarged areas of yellow and green squares in D. Quantification of branch points in the front (F) and the central areas (G). H and I, Tip cells and the quantification. Arrows show tip cells. J and K, Filopodia extension and the quantification. Mean±SD; n=3. **P<0.01. Scale bar: A, D, and E: 200 μm; H and J: 20 μm.