
- Title
-
The hypothalamic NPVF circuit modulates ventral raphe activity during nociception
- Authors
- Madelaine, R., Lovett-Barron, M., Halluin, C., Andalman, A.S., Liang, J., Skariah, G.M., Leung, L.C., Burns, V.M., Mourrain, P.
- Source
- Full text @ Sci. Rep.
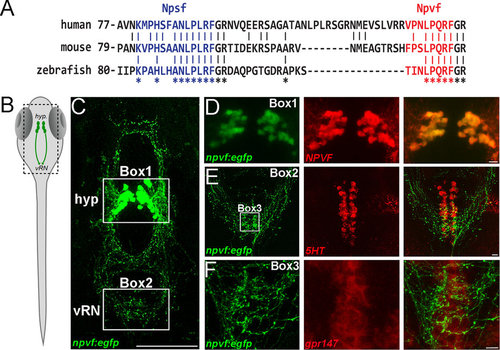
NPVF circuit interacts with the raphe nucleus. (A) Alignment of human, mouse and zebrafish NPVF precursors. Multiple sequence alignments show strong conservation in the sequence of putative NPSF (blue) and NPVF (red) neuropeptides. Stars indicate sequence identity across the alignment. (B) Schematic of larval zebrafish, with location of NPVF neurons (hyp.: hypothalamus; vRN: ventral raphe nucleus). (C) Confocal Z-projection of Tg(npvf:EGFP) larval fish at 5 dpf. Hypothalamus and vental raphe nucleus are highlighted in Box 1 and 2 respectively. (D) Confocal overlay of EGFP+ neurons and NPVF peptide in the hypothalamus at 5 dpf. (E) eGFP+ axons and 5HT antibody stain in the raphe nucleus at 5 dpf. (F) Neurons in the vRN are positive for in situ hybridization for gpr147 at 5 dpf. Scale bars: C = 100 μm, D, E and F = 10 μm. EXPRESSION / LABELING:
|
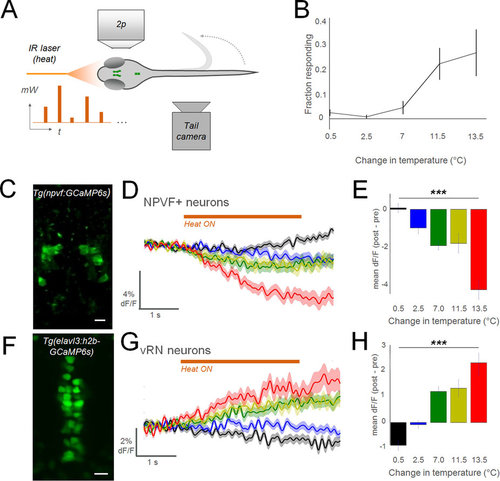
Noxious stimuli inhibit NPVF neurons and activate the vRN. (A) Schematic of experimental configuration (mW: milliwatt, output of laser; t: time). (B) Results of behavior in wildtype larvae (n = 12; mean ± SEM). (C) 2p imaging field of view in Tg(npvf:GCaMP6s) larva: average of time-series. (D,G) Summed responses of all recorded neurons in each group. Colors indicate level of heat, as denoted in summary graphs (E,H) to right (±SEM). In a single larva, multiple cells were analyzed (10 trials in each heat level, 50 trials total per larva). NPVF: n = 113 neurons in 13 larvae. vRN neurons: 173 cells in 6 larvae. (E,H) Summary data for each cell type (±SEM). 1-way anova test. ***p < 0.001. (F) 2p imaging field of view in Tg(elavl3:h2b-GCaMP6s) larva: average of time-series. Scale bar: 10 μm. |
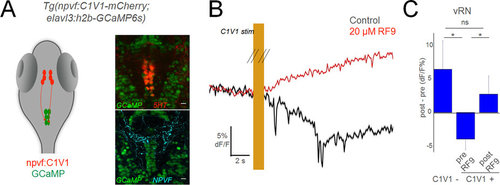
NPVF neurons in the hypothalamus inhibit serotonergic vRN. (A) Schematic of optogenetic experiments, and overlay of 5HT or NPVF antibody stains on GCaMP+ vRN neurons. (B) Mean response of vRN neurons to optogenetic activation of NPVF neurons, before and after application of gpr147 antagonist RF9. Responses are the mean of all neurons in one example larva (mean ± standard error of the mean (SEM)). (C) Grouped data from C1V1− (5 larvae), and C1V1+ (5 larvae) before and after RF9 application (mean ± SEM). Comparisons are 2-tailed t-tests. *p < 0.05; ns: not significant (p > 0.05). |
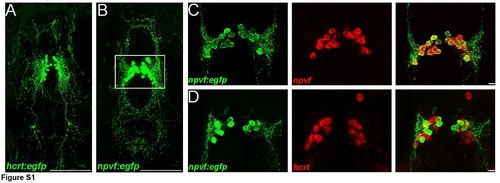
Co-expression of npvf but not hcrt in Tg(npvf:eGFP) larval zebrafish A) Confocal Z-projection of Tg(npvf:EGFP) larval fish at 5 dpf. B) Confocal Z-projection of Tg(hcrt:EGFP) larval fish at 5 dpf. C) Confocal z-projection from Tg(npvf:EGFP) and npvf in situ hybridization showing colocalization. D) Confocal z-projection from Tg(npvf:EGFP) and hcrt in situ hybridization showing that Npvf+ neurons are not expressing hcrt. Scale bars: 100 μm (A, B) or 10 μm (C, D) EXPRESSION / LABELING:
|
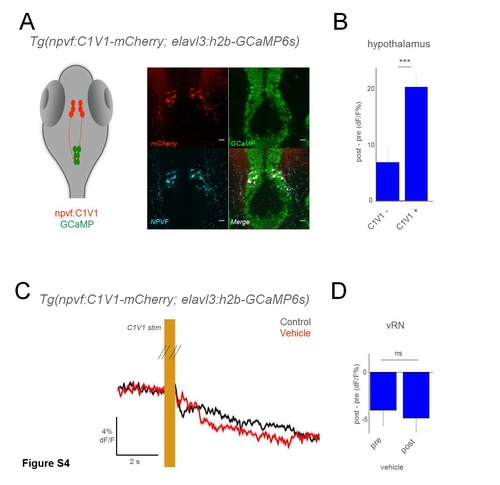
Optogenetic activation of NPVF neurons using C1V1. A) Schematic of optogenetic experiments, and overlay of mCherry and NPVF antibody stains on GCaMP+ hypothalamus neurons in Tg(elavl3:h2b-GCaMP6s) larvae. B) Grouped data from C1V1- (3 larvae), and C1V1+ (10 larvae). C) Schematic of optogenetic experiments, and mean response of vRN neurons to optogenetic activation of NPVF+ neurons, before and after application of vehicle (swapped out fish water). Responses are the mean of all neurons in one example larva. D) Grouped data from C1V1+ fish before and after vehicle application (5 larvae for each condition). Comparison is a 2-tailed t-test. *** p<0.001; ns: not significant (p>0.05) Scale bars: 10 μm |